
Figures & data
Figure 1. Terrains, river system, cities and meteorological stations in the GBA.
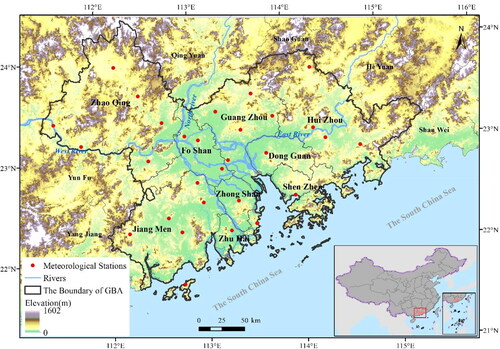
Figure 2. Monthly mean temperature (a) and precipitation (b) in the GBA from 1981 to 2020.
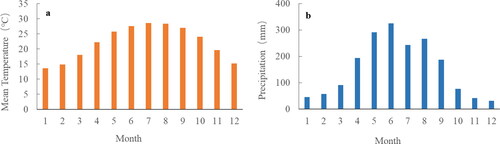
Figure 3. Schematic diagram of components for assessing the risks of rainstorm disasters.
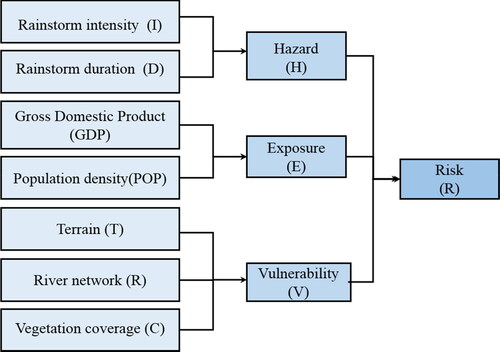
Table 1. Terrain factor assignment.
Table 2. Definition and level intervals for the risks of rainstorm disasters.
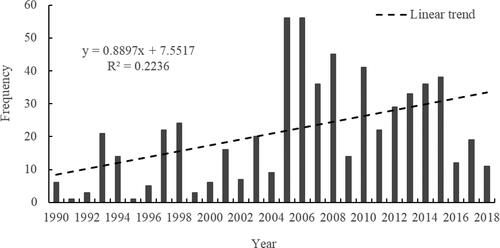
Figure 4. Changes in the frequency (a) and mean intensity (b) of rainstorm processes in the GBA from 1990 to 2018.
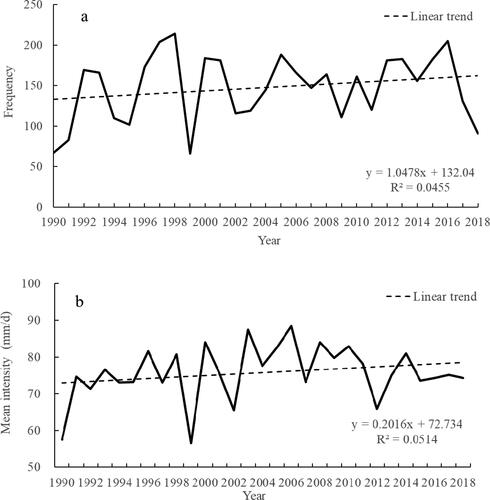
Figure 5. Annual average frequency of rainstorm processes (a) and tendency rate of the frequency (b), as well as average rainstorm intensity (c) and tendency rate of the intensity (d).
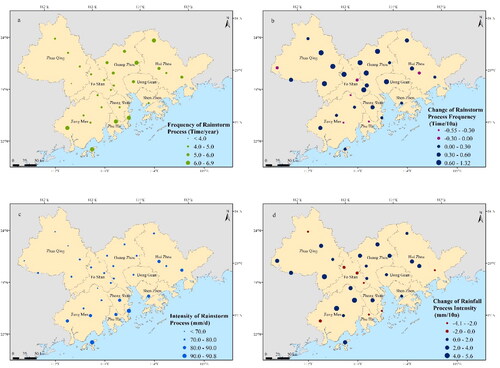
Figure 6. The distribution of hazard index of 20-year-return-period in the GBA. Inverse distance weighted (IDW) interpolation technique in ArcGIS was used to create the figure.
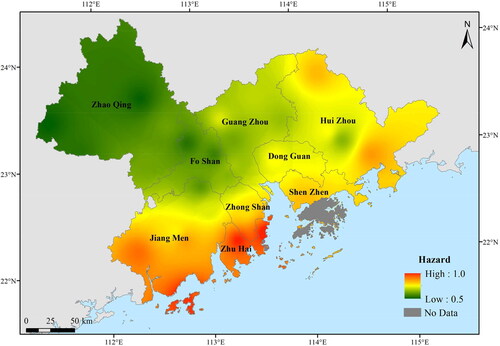
Table 3. Averages of hazard, exposure, vulnerability and risk indexes of cities in the GBA.
Figure 7. The spatial distribution of GDP (a), POP (b) and exposure index (c) in the GBA. Inverse distance weighted (IDW) interpolation technique in ArcGIS was used to create the figure.
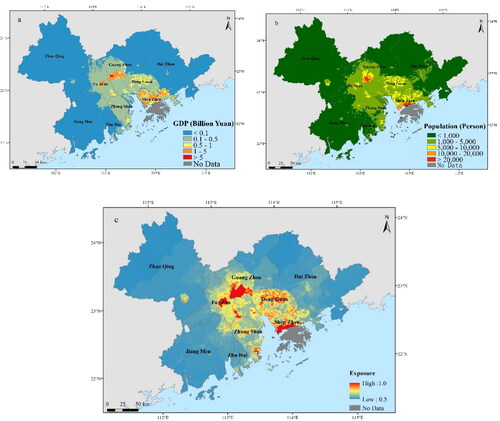
Table 4. Changes in urban land use and socio-economic indicators in cities of the GBA (Didan Citation2015; http://www.resdc.cn/Default.aspx.).
Figure 8. The distribution of terrain (a), river network (b), vegetation coverage (c) and vulnerability (d) indexes in the GBA. Inverse distance weighted (IDW) interpolation technique in ArcGIS was used to create the figure.
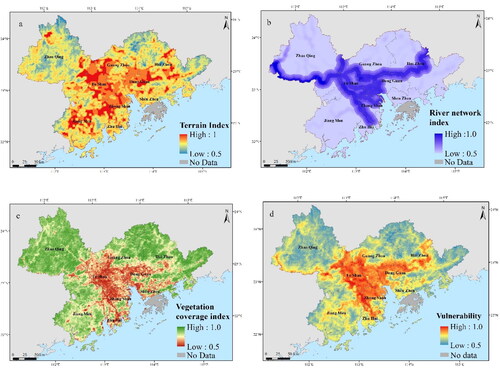
Figure 9. Risk levels of rainstorm disasters in the GBA from 1990 to 2018.
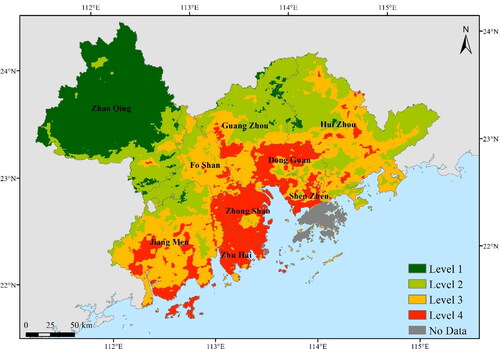
Table 5. Area percentages (%) of rainstorm disaster risk levels in the GBA.
Figure 10. Distributions for the numbers of rainstorm disasters (a), urban waterlogging disasters (b), floods (c) and geological disasters (d) in the GBA from 1990 to 2018.
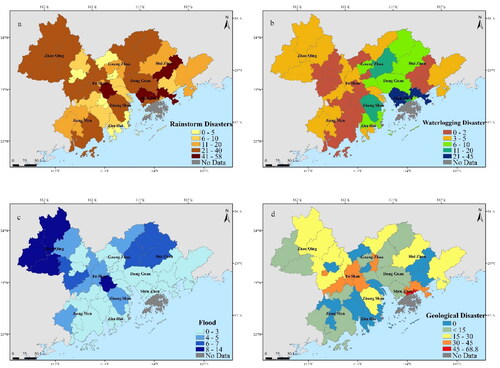
Figure 11. Changes of the disaster-induced rainstorms in the GBA from 1990 to 2018.
Data availability statement (DAS)
The data that support the findings of this study are openly available on websites (www.resdc.cn and www.data.cma.cn).