
Figures & data
Table 1. Data resource and description.
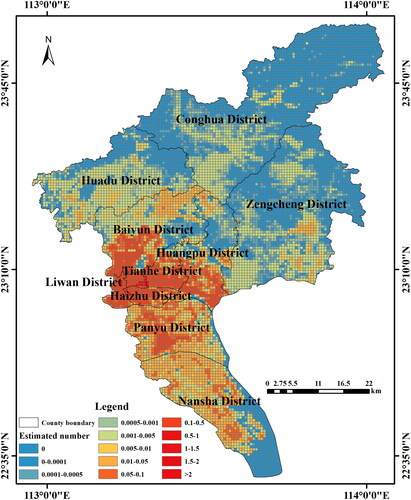
Figure 1. Results of the population grid distribution in the study area (0.1 km*0.1 km).
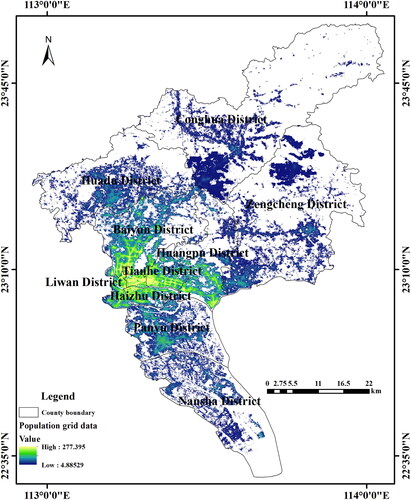
Figure 2. Technical process of the earthquake disaster risk assessment method based on the lethal level.
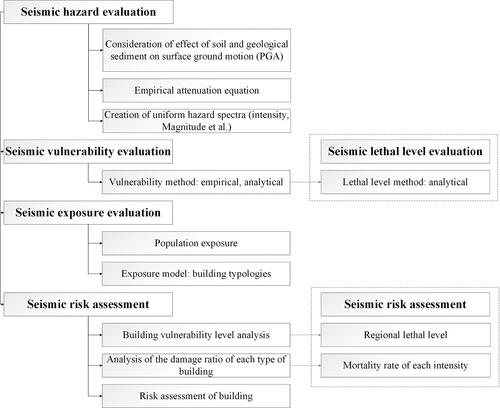
Table 2. Matrix based on the lethal level and intensity.
Table 3. The interval and influencing factors of the lethal level of buildings.
Figure 3. Distribution map of field survey points in Guangzhou city.
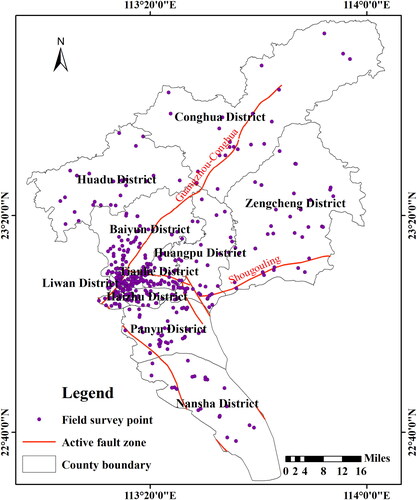
Table 4. Types and specific characteristics of buildings in Guangzhou.
Figure 4. Distribution of lethality levels based on field survey results.
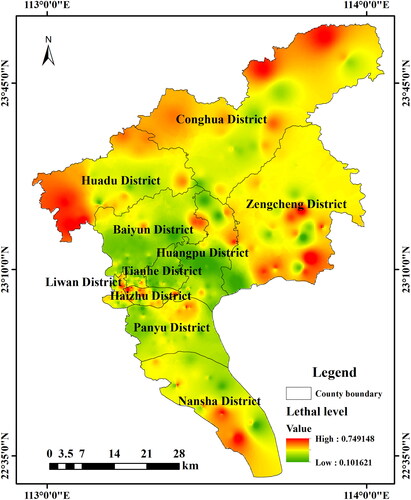
Figure 5. The log cumulative normal distribution of the lethal level in urban and rural areas.
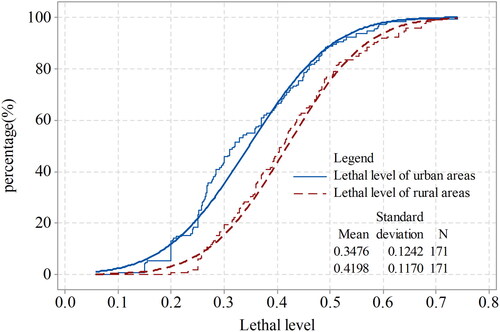
Table 5. Calculation results of the lethal level in various townships in Guangzhou.
Figure 6. Fitting results of the overall lethal level of urban areas, rural areas and each town.
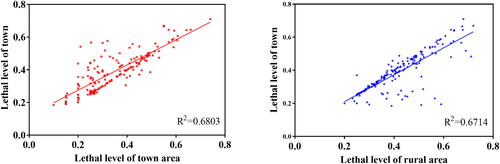
Figure 7. Grid assessment results of earthquake lethal risk in Guangzhou with different intensity (a: the risk result when the study area suffers from an intensity of VI; b: the risk result when the study area suffers from an intensity of VI; c: the risk result when the study area suffers from an intensity of VI; d: the risk result when the study area suffers from an intensity of VI; e: the risk result when the study area suffers from an intensity of VI; f: the risk result when the study area suffers from an intensity of VI).
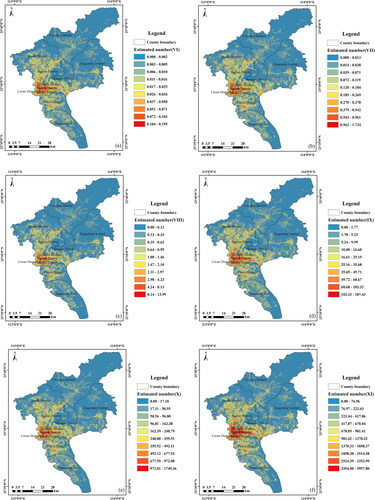
Figure 8. PGA distribution results in Guangzhou.
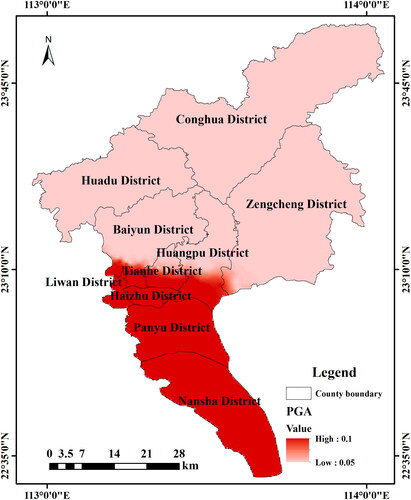
Figure 9. The grid distribution results of the mortality rate of various townships in Guangzhou.
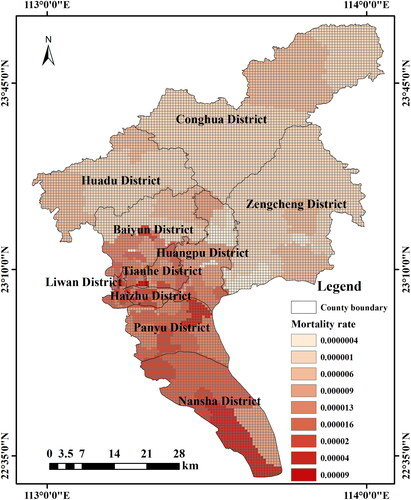
Figure 10. Grid assessment results of earthquake lethal risk in Guangzhou.
Data availability statement
The data that support the findings of this study are available from the corresponding author, Chaoxu Xia, upon reasonable request.