
Figures & data
Figure 1. Map of sampling site (S for water and sediment of river; C for milkfish sampling; and A for shellfish sampling). Source: Author.
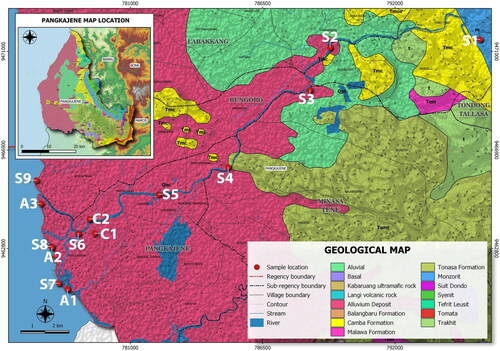
Table 1. Symbol, definitions, units, and values related to health risk assessment.
Table 2. Comparison of measured selected PTEs in River Water (RW) and River sediment (RS) with environmental quality criteria and world average concentrations.
Table 3. Comparison of mean selected PTEs in shellfish (Anadara granosa), milkfish (Chanos chanos) with food quality criteria.
Table 4. Human exposure characteristics in the coastal community of Pangkep regency, Indonesia.
Table 5. Noncarcinogenic risk of PTEs exposure in the Pangkajene’s coastal community (N = 287).
Table 6. Carcinogenic risk of PTEs exposure in the Pangkajene’s coastal community (N = 287).
Figure 2. Cumulative probability of THI (A) and TCR (B) through combined pathways. THI: total hazard index; TCR: total cancer risk.
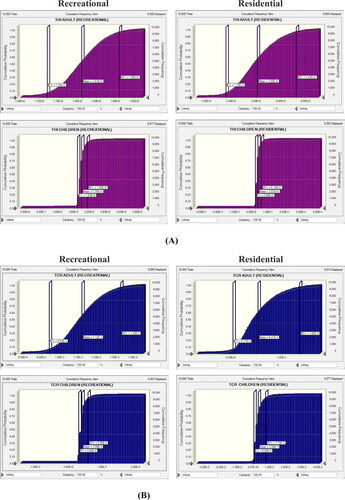
Figure 3. Sensitivity results for THI value in residential (A), and in recreational receptors (B); the result of Monte Carlo Simulation, Total Hazard Index (THI) defined as a forecast value, and the assumptions include PTEs concentration in river water (RW), in river sediment (RS), milkfish (MF) and shellfish (SF), Ingestion rate (IR), exposure frequency (EF), Body weight (BW), Exposure duration (ED).
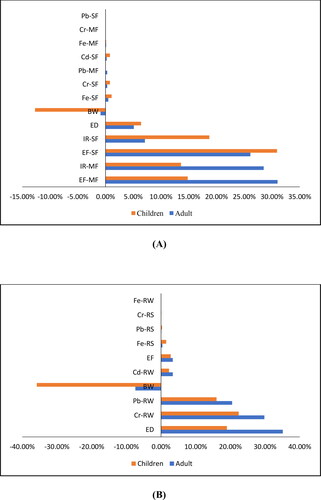
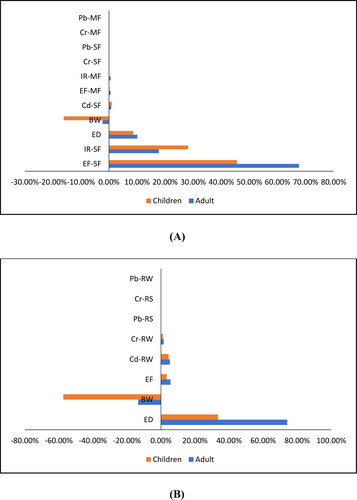
Figure 4. Sensitivity results for TCR value in residential (A), and in recreational receptors (B); the result of Monte Carlo Simulation, Total Cancer Risk (TCR) is defined as a forecast value, and the assumptions include PTEs concentration in river water (RW), river sediment (RS), milkfish (MF), and shellfish (SF), Ingestion rate (IR), exposure frequency (EF), Body weight (BW), Exposure duration (ED).
Supplemental Material
Download MS Word (53.5 KB)Data availability
The datasets obtained and/or analyzed during the current study are not publicly available but are available from the corresponding author on reasonable request.