
Figures & data
Figure 1. Standard False Color Composite (FCC) map of the study area highlighting impact location.
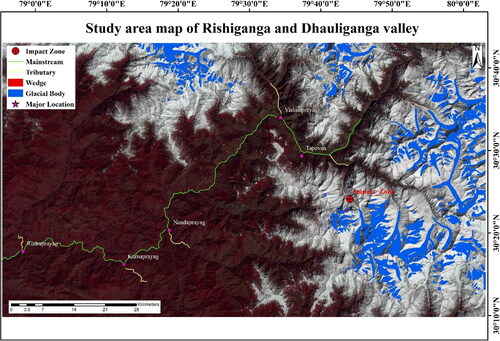
Figure 2. Image representing slope and impact location (Google Earth Pro image of 11-Feb-2021).
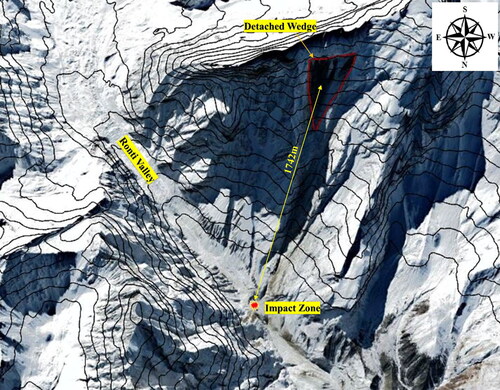
Figure 3. Wedge structure captured by Sentinel-2 MSI.
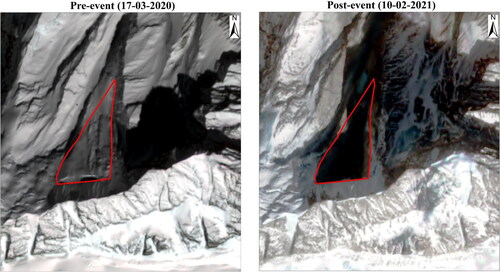
Table 1. Details of offset-tracking pairs from Sentinel-1A.
Figure 4. Flowchart indicating the adopted methods.
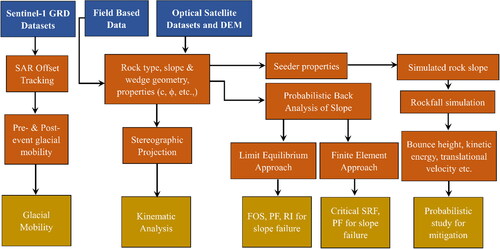
Figure 5. Sub-pixel offset tracking process flow for surficial displacement using Sentinel-1 GRD wide swath imagery.
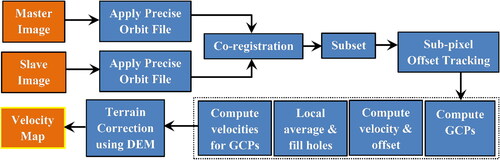
Figure 6. Generalized physical model of the wedge structure found in the study area.
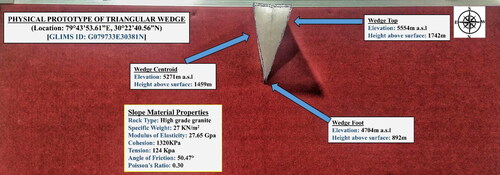
Table 2. Inputs to analysis of slope stability.
Table 3. Inputs for numerical simulation of rock/ice fall.
Table 4. Stochastic parameters of rockfall.
Figure 7. Map showing annual mobility of the glacial bodies in the Rishiganga and the Dhauliganga valley between 2020 and 2021.
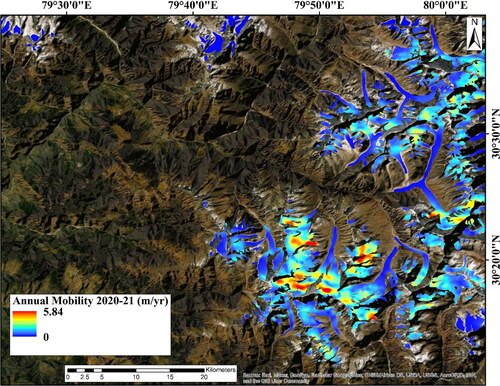
Figure 8. Map showing annual (a) and seasonal (pre-monsoon: (b); monsoon: (c); post-monsoon: (d)) mobility of the Ronti glacier and wedge between 2020 and 2021.
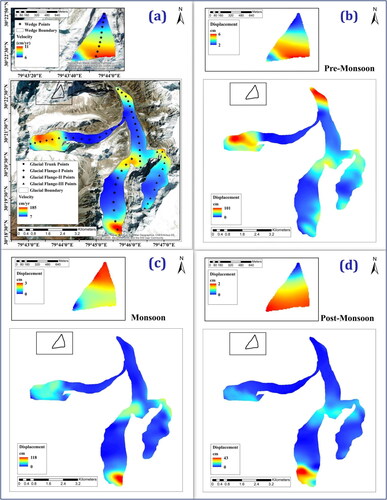
Figure 9. Indicating the mobility trend of (a) trunk, (b-d) flange-I/II/III of Ronti glacier and (e) wedge respectively.
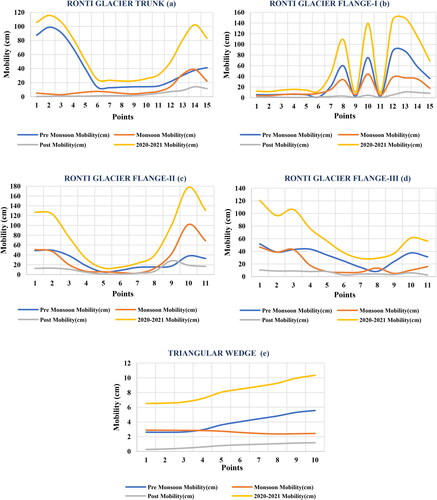
Figure 10. Kinematic analysis showing results for planar sliding (left) and wedge sliding (right) failure.
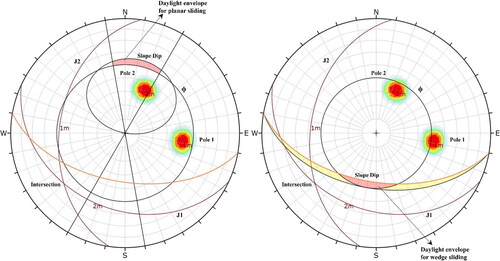
Table 5. Orientation of joint sets and rock slope.
Figure 11. Result from limit equilibrium analysis of rock slope (at 20% CoV).
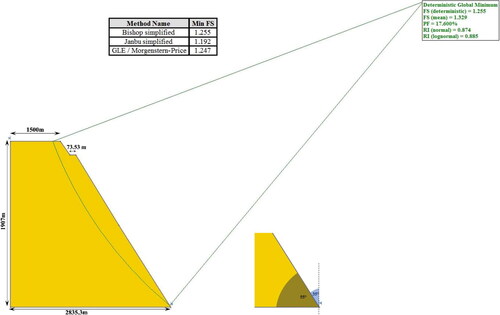
Figure 12. Result from Finite element SSR (left; at 20% CoV) and Rockfall analysis (right) of rock slope.
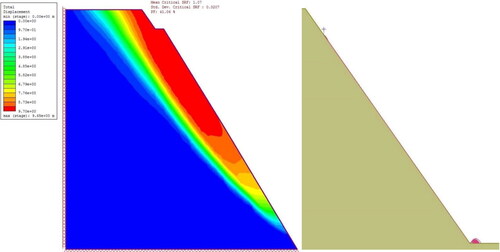
Table 6. Probabilistic back analysis results (LEM and FEM-SSR).
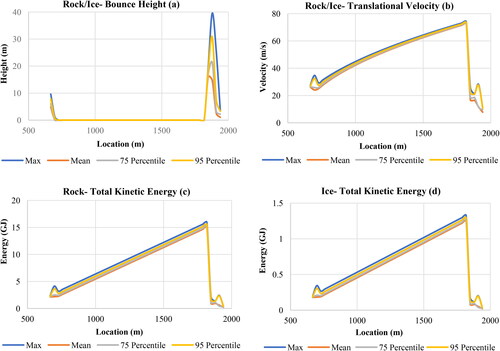
Figure 13. Illustration for (a) BH, (b) TV and (c-d) TKE of rock and ice fall at mean, maximum, 75 percentiles and 95 percentiles respectively.
Data availability statement
The data used for the study has been collected from different agencies that can be assessed using the following links.
SENTINEL-2 MSI: https://scihub.copernicus.eu/dhus/#/home
ALOS PALSAR: https://search.asf.alaska.edu/#/?zoom=5.915¢er=96.406,16.491&dataset=ALOS
RANDOLPH GLACIER INVENTORY: https://www.glims.org/RGI/rgi60_dl.html