
Figures & data
Figure 1. Geographical map of the study area, Jharkhand state and its major cities, India.
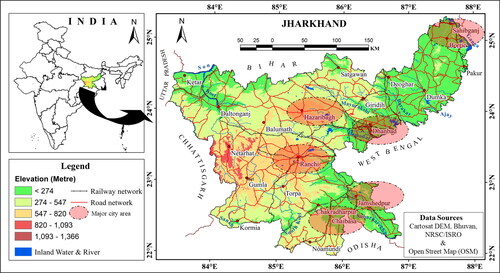
Figure 2. Flow chart of the methodology for assessing spatio-temporal trends of variation of AOD over Jharkhand state, India from 2000 to 2017.
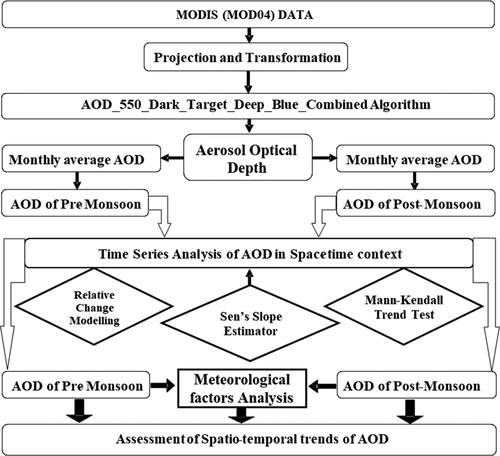
Figure 3. Annual Spatial trends of aerosol optical depth over Jharkhand state from 2000 to 2017.
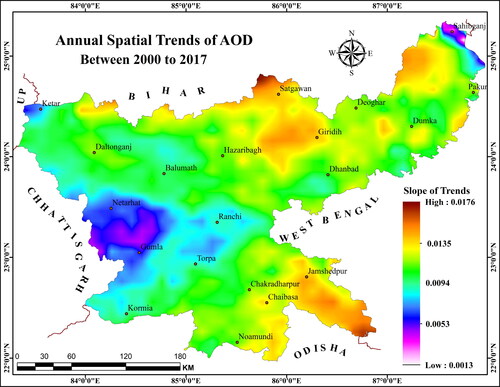
Figure 4. Time series and trend lines for annual AOD over Chaibasa, Jamshedpur, Ranchi, Dhanbad, Hazaribagh, and Sahibganj of Jharkhand state from 2000 to 2017.
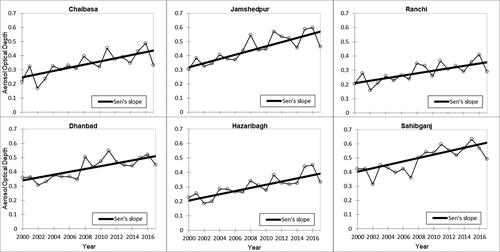
Table 1. Result of Mann–Kendal trend test and Sen’s slope estimator of annual AOD over Chaibasa, Jamshedpur, Ranchi, Dhanbad, Hazaribagh, and Sahibganj of Jharkhand state from 2000 to 2017.
Figure 5. Annual distribution of aerosol optical depth over Jharkhand state from 2000 to 2017 in pre-monsoon and post-monsoon season.
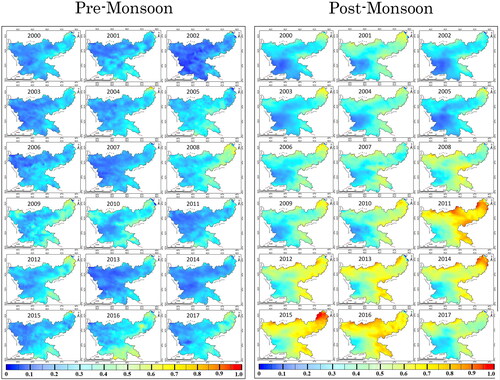
Figure 6. Box and Whisker plots showing the variation of mean AOD for pre-monsoon (a) and post-monsoon (b) seasons from 2000 to 2017 of 6 major cities of Jharkhand state; Chaibasa, Jamshedpur, Ranchi, Dhanbad, Hazaribagh, and Sahibganj represented by A–F, respectively.
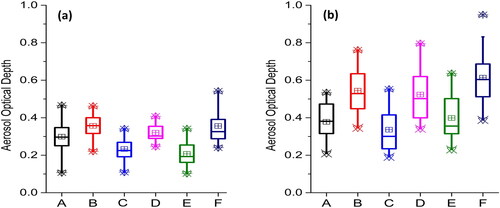
Figure 7. Pixel-based relative change of AOD for pre-monsoon (a–c) and post-monsoon (d–f) seasons over Jharkhand state for the periods between 2000 and 2017.
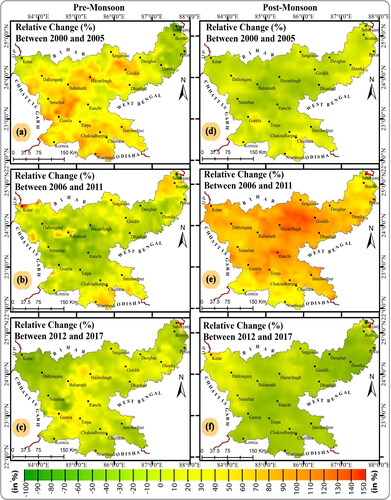
Figure 8. Seasonal Spatial trends of Aerosol Optical Depth of Pre-monsoon and Post-monsoon seasons over Jharkhand state; (a) Trends of AOD in Pre-monsoon season during 2000–2005, (b) Trends of AOD in Pre-monsoon season during 2006–2011, (c) Trends of AOD in Pre-monsoon season during 2011–2017, (d) Trends of AOD in Post-monsoon season during 2000–2005, (e) Trends of AOD in Post-monsoon season during 2006–2011, and (f) Trends of AOD in post-monsoon season during 2011–2017.
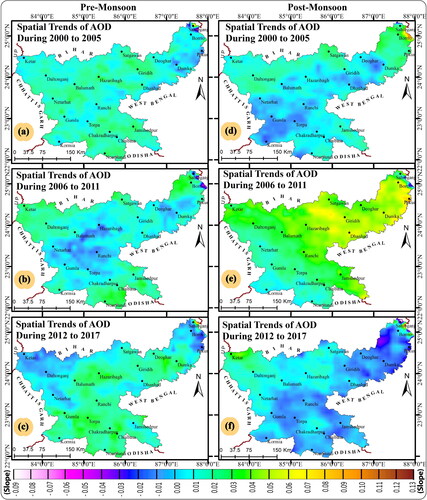
Table 2. Summary of Sen’s slope of aerosol optical depth for pre-monsoon and post-monsoon season of Jharkhand state.
Figure 9. Seasonal time series and trend lines (Mann–Kendall Trend Test) of aerosol optical depth (AOD) for six major cities of Jharkhand state from 2000 to 2017 in Pre-monsoon (a–f) and post-monsoon (g–l); (a and g) Chaibasa, (b and h) Jamshedpur, (c and i) Ranchi, (d and j) Dhanbad, (e and k) Hazaribagh, and (f and l) Sahibganj.
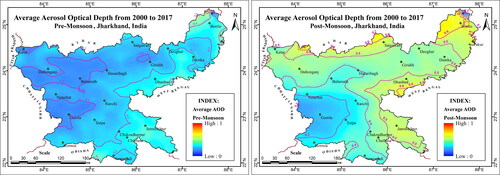
Figure 10. Scatter plot matrix and wind rose showing the correlation between AOD and meteorological parameters of Jharkhand state from 2000 to 2017; (a) correlation between AOD, temperature, relative humidity (RH), wind speed, and wind direction; (b,c) Wind rose plot of pre-monsoon and post-monsoon season, respectively, over Jharkhand state.
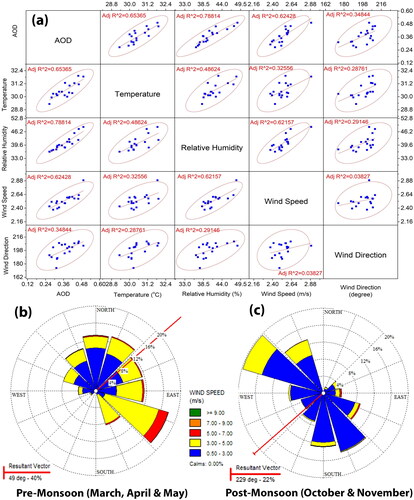
Table 3. Result of Mann–Kendal trend test and Sen’s slope estimator of AOD of pre-monsoon season over Chaibasa, Jamshedpur, Ranchi, Dhanbad, Hazaribagh, and Sahibganj of Jharkhand state from 2000 to 2017.
Table 4. Result of Mann–Kendal trend test and Sen’s slope estimator of AOD of post-monsoon season over Chaibasa, Jamshedpur, Ranchi, Dhanbad, Hazaribagh, and Sahibganj of Jharkhand state from 2000 to 2017.
Figure 11. Multi-year average AOD of Terra MODIS sensor for pre-monsoon and post-monsoon seasons over Jharkhand state from 2000 to 2017.
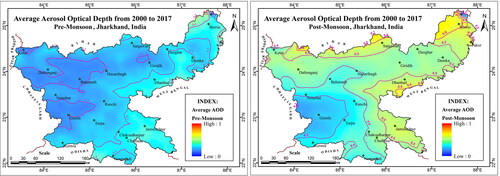
Figure 12. Comparative analysis of seasonal variation of AOD between pre and post-monsoonal seasons 2000, 2005, 2010, 2015, and 2017 over (a) Chaibasa, (b) Jamshedpur, (c) Ranchi, (d) Dhanbad, (e) Hazaribagh, and (f) Sahibganj of Jharkhand state.
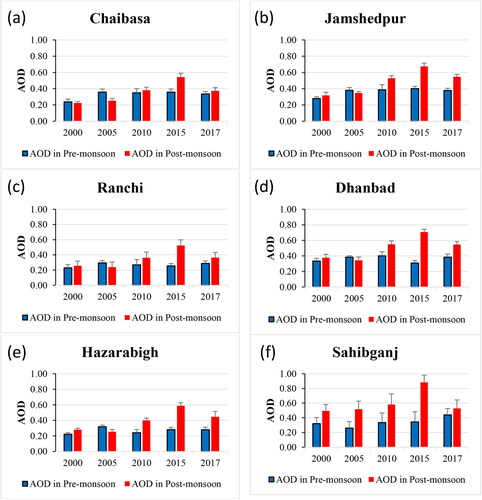
Table 5. Averaged AOD of the year 2000, 2005, 2010, 2015, and 2017 over Chaibasa, Jamshedpur, Ranchi, Dhanbad, Hazaribagh, and Sahibganj of Jharkhand state in pre- and post-monsoonal periods.
Figure 13. The geospatial pattern of average aerosol optical depth over Jharkhand state from 2000 to 2017.
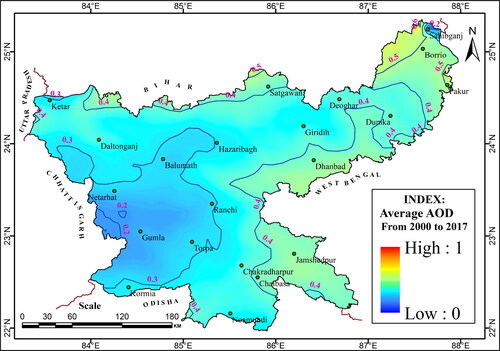
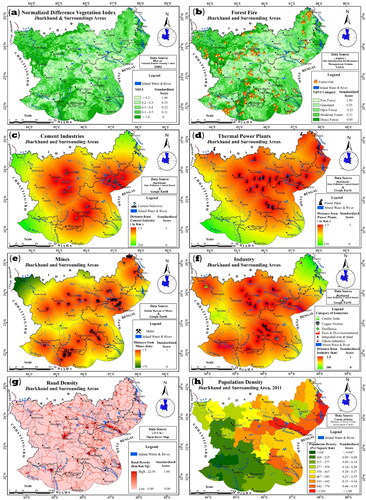
Figure 14. ‘Most important parameters for the identification of sources of aerosols: (a) spatial distribution of average NDVI; (b) forest fire (constant occurrence from 2011-2017); (c) cement industries; (d) thermal power plants; (e) mines; (f) highly polluting industries; (g) road density; and (h) population density over Jharkhand state and surrounding areas (Census of India Citation2011)’ (Bandyopadhyay et al. Citation2021).
Availability of data and materials
The data that support the findings of this study are available from the author, [Lal Mohammad, [email protected] and Quoc Bao Pham, [email protected]], upon reasonable request.