
Figures & data
Figure 1. Agroecological regions of Zimbabwe (Vincent and Thomas, 1961) overlaid on Sentinel 2016 landcover map (European Space Agency, Citation2016)
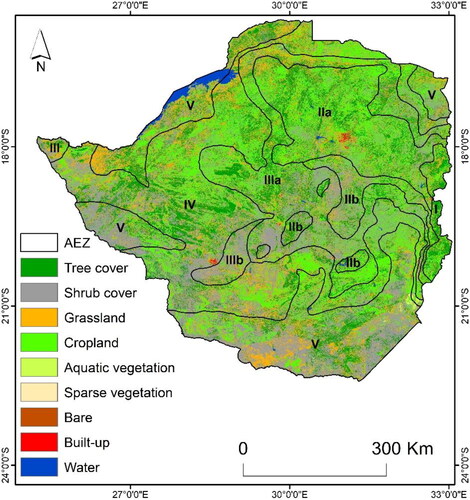
Table 1. The rainfall and agriculture potential of the five agro-ecological regions of Zimbabwe.
Table 2. The name and location of Meteorological stations where rainfall used for validating Vegetation Condition Index was derived as well as the Agro-ecological regions across a rainfall gradient in Zimbabwe.
Table 3. Metrics used to validate the satellite derived drought index based on SPI calculated from six rainfall stations across Agro-ecological regions of Zimbabwe.
Figure 2. Frequency of drought occurrence for the months of a) October, b) November, c) December, d) January, e) February, f) March and g), April.
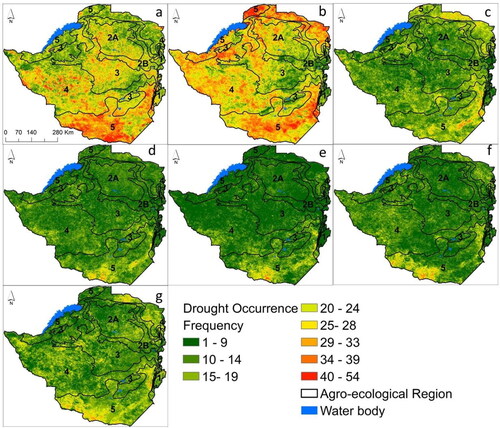
Figure 3. Spatial variation in drought frequency at the annual scale across Agro-ecological regions of Zimbabwe for the years a) 2000, b) 2001, c)2002, d) 2003, e) 2004, f) 2005, g) 2006, h)2007, i) 2008, and, j) 2009.
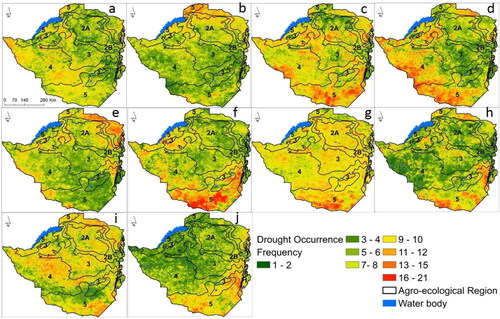
Figure 4. The spatial variation in the frequency of drought occurrence at the annual scale across Agro-ecological regions of Zimbabwe for the years a) 2010, b) 2011, c) 2012, d) 2013, e) 2014, f) 2015, g) 2016, h) 2017 and, i) 2018.
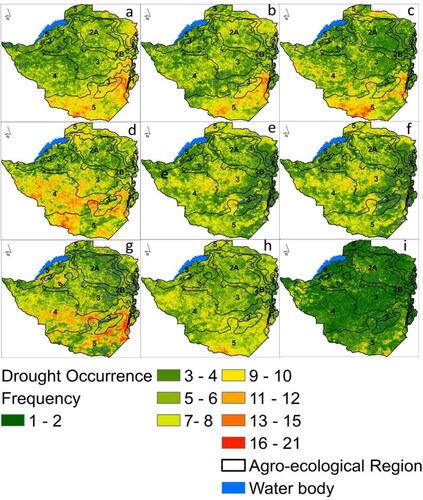
Figure 5. The spatial variations in drought frequency across Zimbabwe in the first and second part of season from the year 2000 to 2018.
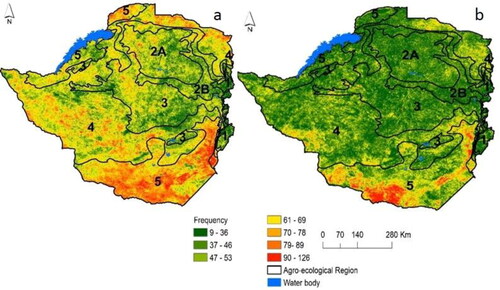
Figure 6. Overall drought frequency from the year 2000 to 2018.
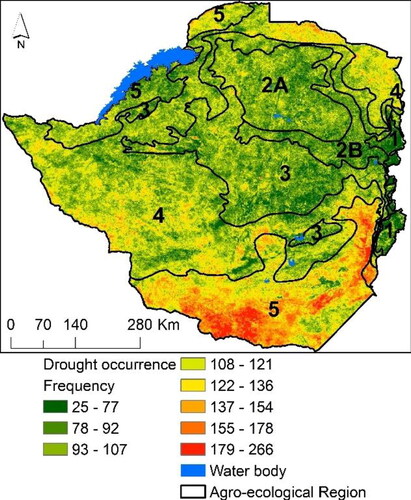
Figure 7. Probability of drought occurrence based on dekadal data from 2000 to 2018.
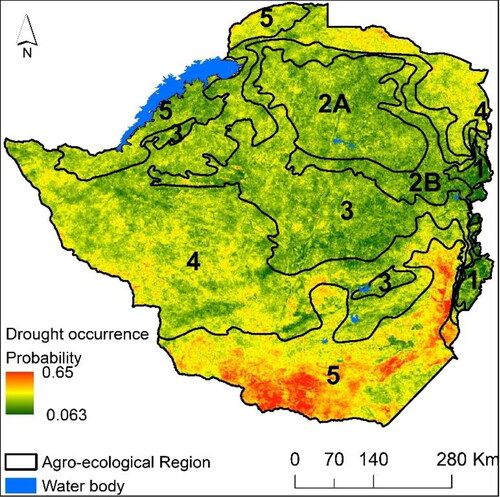
Table 4. Validation of vegetation condition index based on one month standardised precipitation index derived from six stations distributed across agro-ecological regions of Zimbabwe.
Table 5. Validation of vegetation condition index based on 3-month standardised precipitation index derived from six stations distributed across agro-ecological regions of Zimbabwe.
Figure 8. The relationship between maize yield (in 1000 metric tonnes) and Vegetation Condition Index (a) for each of the years from 1998 to 2018 and b) for the 20-year period.
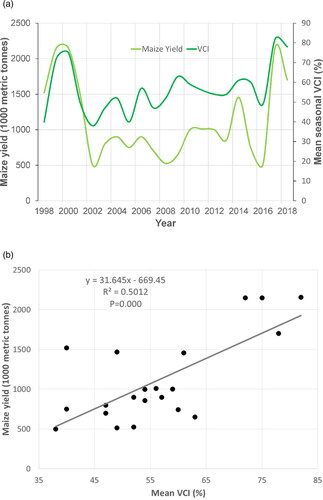
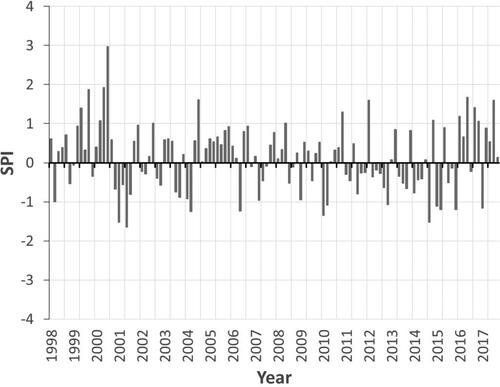
Figure 9. Variations in monthly SPI based on rainfall measured from 1981 to 2020 at Beitbridge weather stations in Zimbabwe.
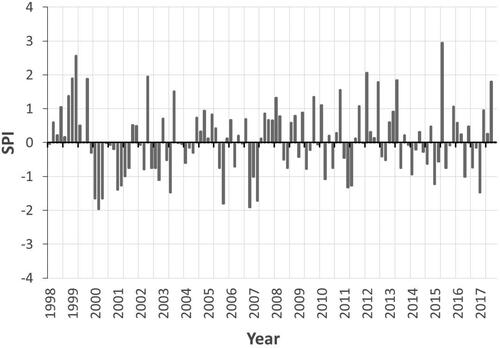
Figure 10. Variations in monthly SPI based on rainfall measured from 1981 to 2020 at Kadoma weather stations in Zimbabwe.
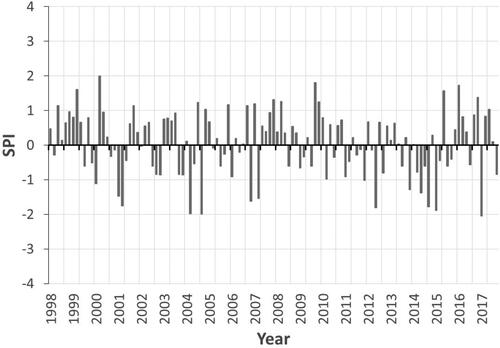
Figure 11. Variations in monthly SPI based on rainfall measured from 1981 to 2020 at Masvingo weather station in Zimbabwe.
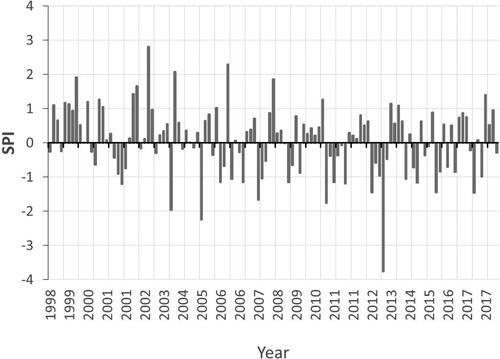
Figure 12. Variations in monthly SPI based on rainfall measured from 1981 to 2020 Mutoko weather station in Zimbabwe.
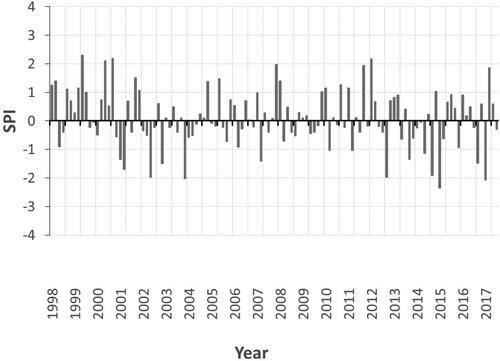
Figure 13. Variations in monthly SPI based on rainfall measured from 1981 to 2020 at Mvurwi weather station in Zimbabwe.
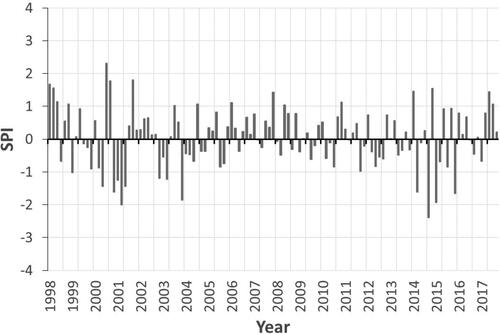
Figure 14. Variations in monthly SPI based on rainfall measured from 1981 to 2020 at Nyanga weather station in Zimbabwe.
Data availability
NDVI datasets used in this study are readily available at http://www.vito_eodata.be.