
Figures & data
Figure 1. Location of the study area.
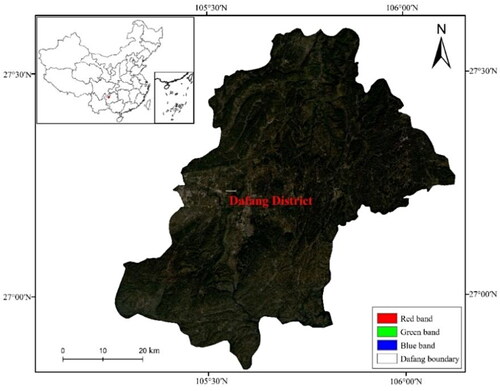
Table 1. Band information of sentinel-2A and sentinel-2B.
Figure 2. The main research flow diagram.
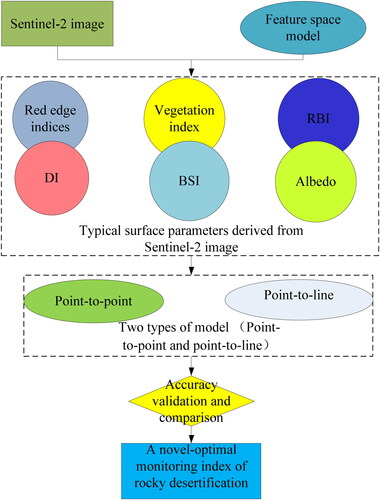
Figure 3. Principle of feature Space Model.
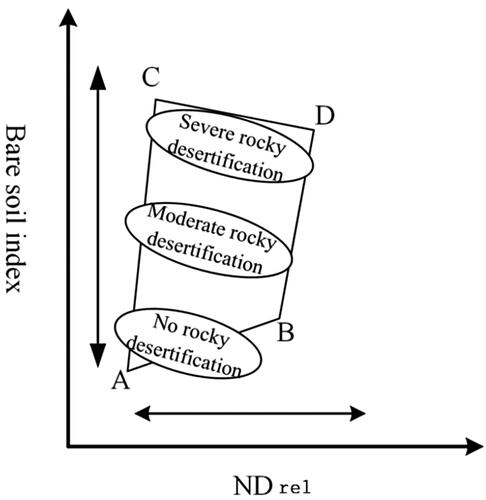
Table 2. Calculation formula of surface parameters.
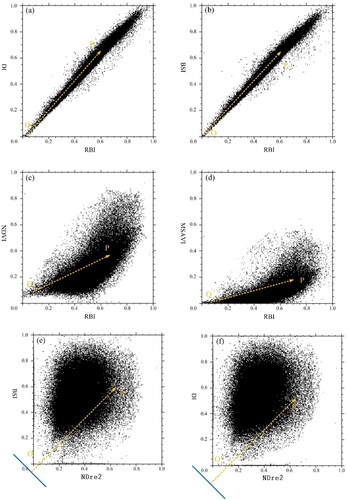
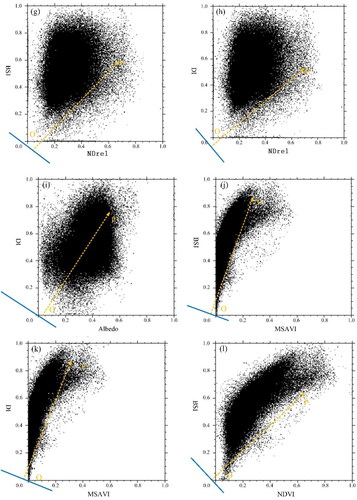
Figure 5. Spatial distribution of rocky desertification in BSI-RBI feature space (a) No; (b) Slight; (c) Moderate; (d) Intensive; (e) Severe.
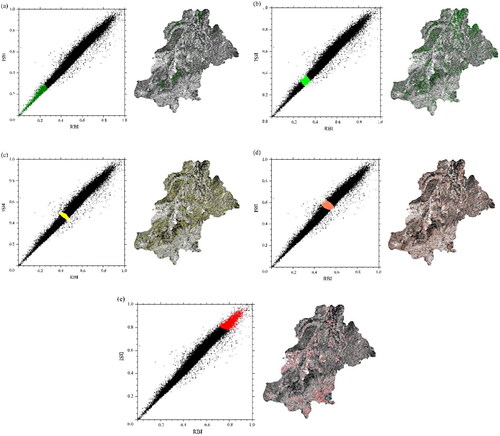
Figure 6. Spatial distribution of rocky desertification in BSI-NDre1 feature space (a) No; (b) Slight; (c) Moderate; (d) Intensive; (e) Severe.
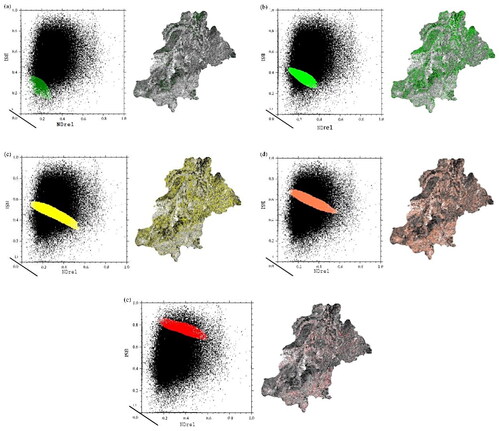
Figure 7. Construction of BSI-RBI feature space monitoring index (point-to-point type).
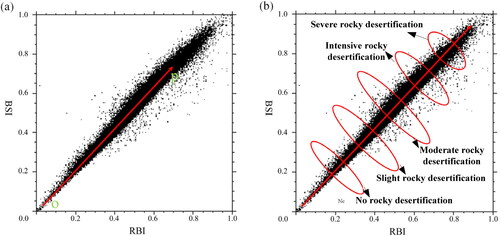
Figure 8. Construction of BSI-NDre1 feature space monitoring index (point-to-line type).
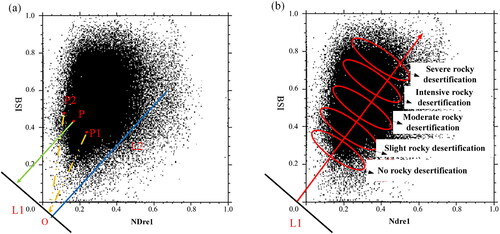
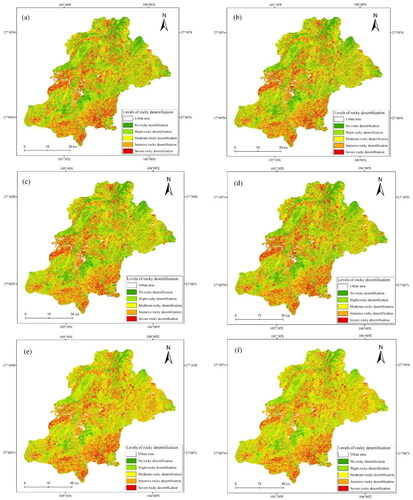
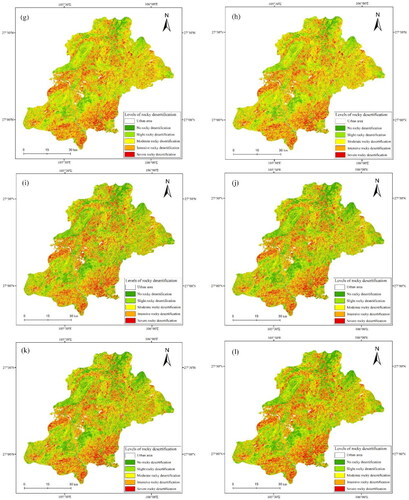
Figure 10. Validation of the inversed rocky desertification index with Google Earth images (BSI-NDre1 feature space monitoring index) (a) No; (b) Slight; (c) Moderate; (d) Intensive; (e) Severe.
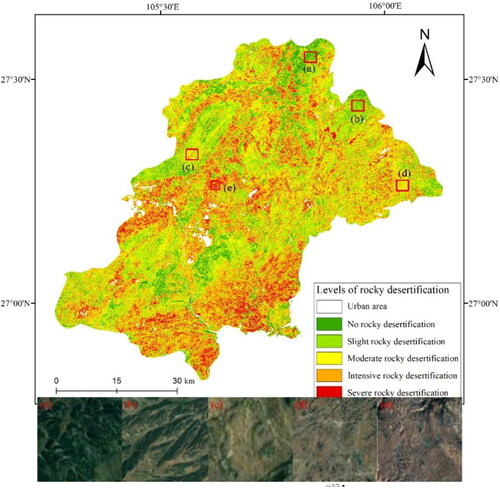
Table 3. Error matrix of the inversed rocky desertification index (BSI-NDre1 feature space) and observed value.
Table 4. Accuracy comparisons of feature space monitoring index based on two types (P < 0.01).
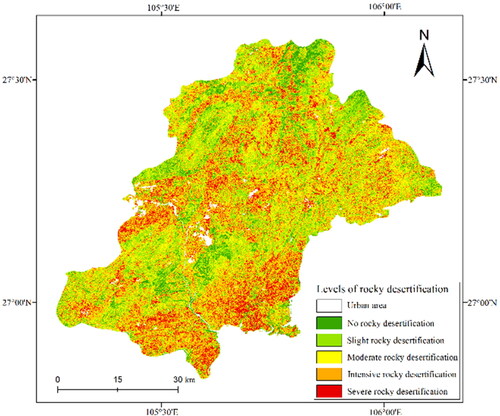
Figure 11. Spatial distributions of rocky desertification in Dafang District.
Data availability statement
The data that support the findings of this study are available from the corresponding author, Guo B, upon reasonable request.