Figures & data
Figure 1. Geographical locations of the chosen stations.
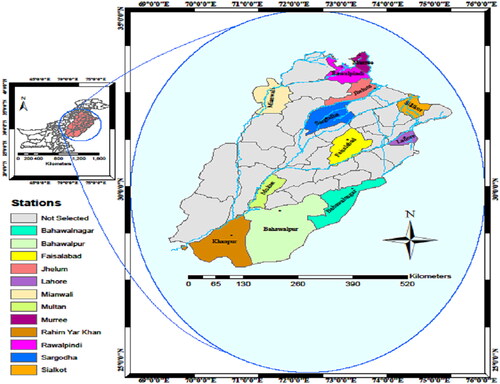
Figure 2. Flowchart of the current methodology is provided. The present research is validate to the several stations. The stations of the provine Punjab is chosen for the analysis. The selction of the province is based on the importance of the region to the other parts of the country. Various industrial good and services are linked with the studied region. Several reseririor system of the country associate with the current region. Several publications have been studying this region for drought analysis (Niaz et al. Citation2020b; Niaz et al. Citation2021a). Based on the significant attraction and importance for the country of the studied region, therefore, the current analysis is made and validated on province Punjab of Pakistan. Further, Based on sufficient requirement of the data set for the SPI calculation, the current analysis is perfomed to the twelve meterological stations. The stations have major role to the agriculture sector of the country. Hence, these statons are examined for the analysis. The SPI-3 is utilized for classifying seasonal MD frequency and persistence. The POM is employed to compute the odds and (PDP in varying seasons.
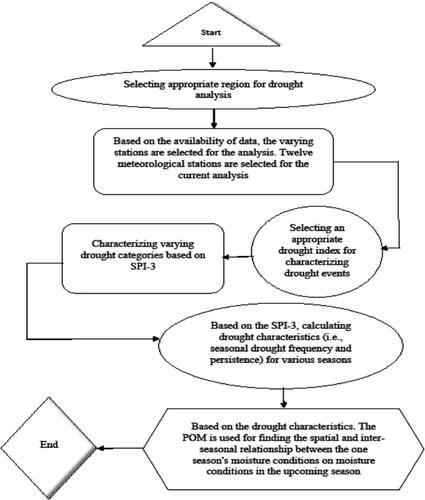
Figure 3. The characteristics (maximum, standard deviation) of the precipitation observed in various stations.
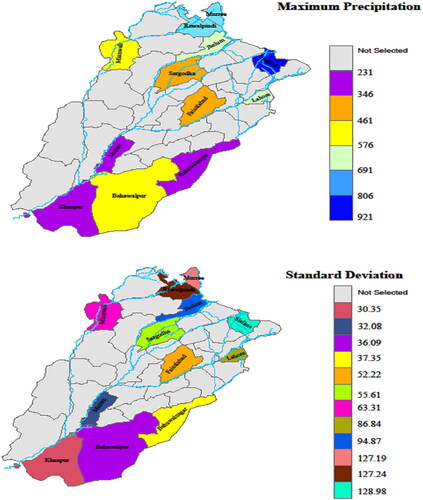
Figure 4. Several histograms for SPI-3 are provided for the selected stations.
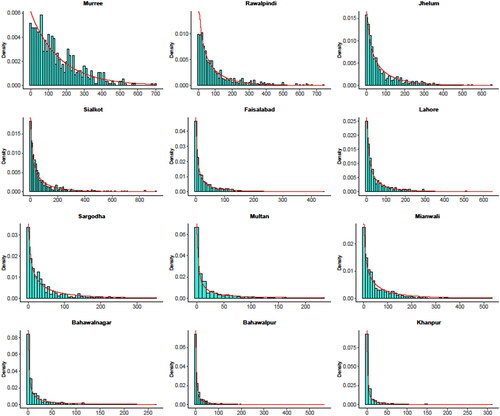
Table 1. Observed precipitation in Faisalabad station on varying months of the specific years.
Table 2. The selected probability distributions of SPI-3 and their BIC values for selected stations.
Figure 5. The temporal plots for SPI-3 at selected stations.
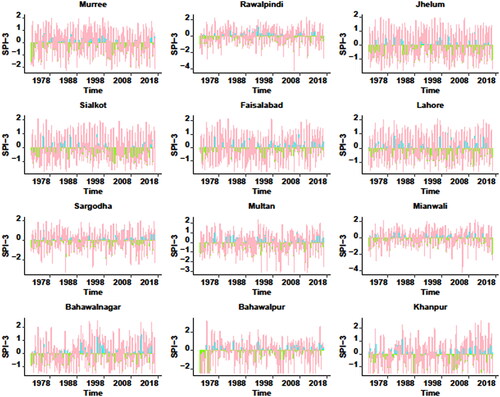
Figure 6. The features (mean, standard deviation) of the SPI-3 in various stations.
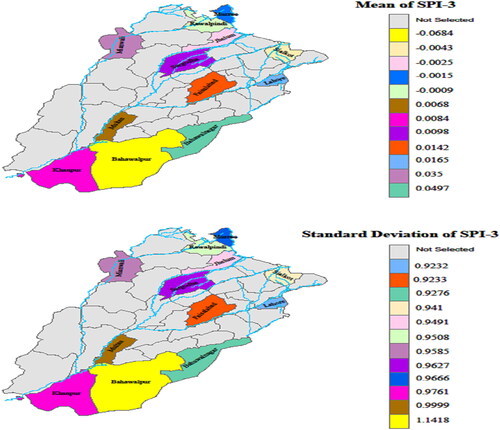
Figure 7. The total number of counts is presented for various drought categories in the selected stations for SPI-3 in different seasons.
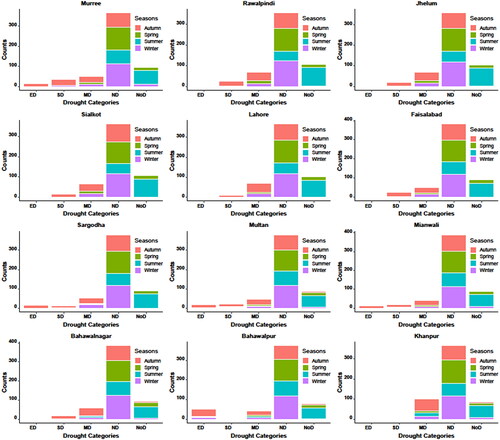
Figure 8. Time series plot: Temporal behavior of ND in selected stations.
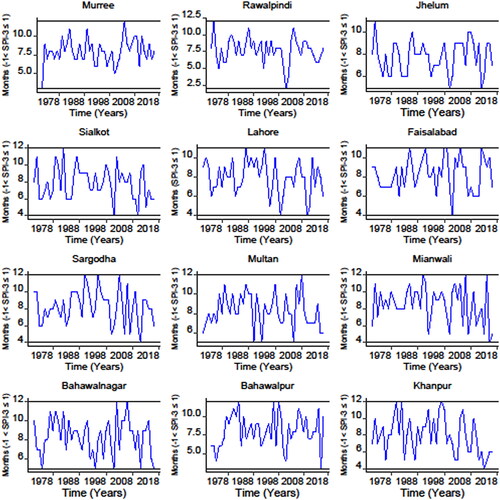
Figure 9. The behavior of ND is presented in this figure. Accordingly, the behavior of other drought categories can be presented.
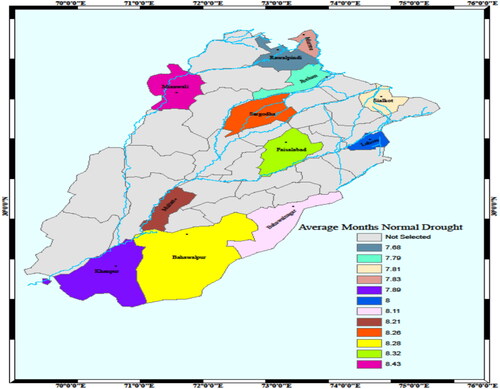
Figure 10. SDF of ND for each chosen station as a percent of total (1971–2017) years. To avoid the presentations of multiple figures based on the same rationale. In the current study, the SDF of ND is only presented here, however, frequency in various seasons for other drought conditions can be presented accordingly.
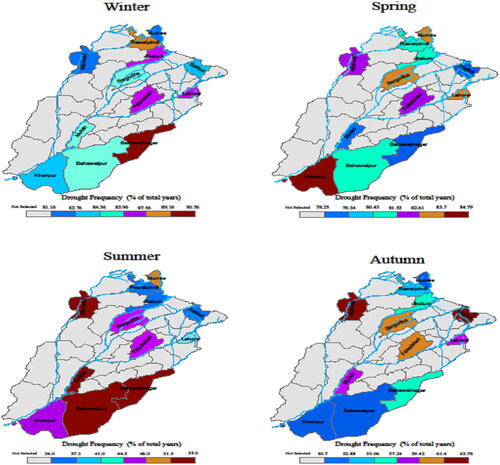
Table 3. Observed SPI-3 values for January varying stations in the specific years.
Table 4. Observed SPI-3 values for Feburary in varying stations in the specific years.
Table 5. The average precipitation was observed in selected stations.
Figure 11. PDP percentage for all seasons in the selected stations. The ND drought condition is only selected for the presentation. The behavior of ND persistence in selected stations can be observed from the spatial map.
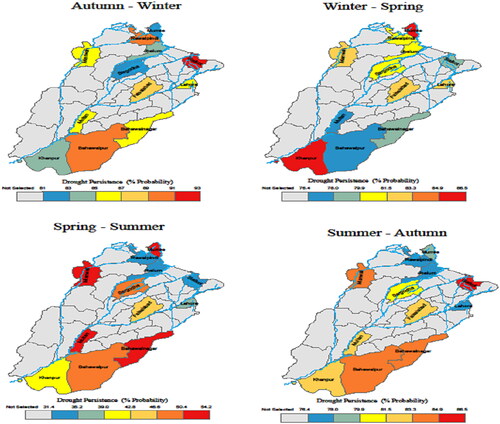
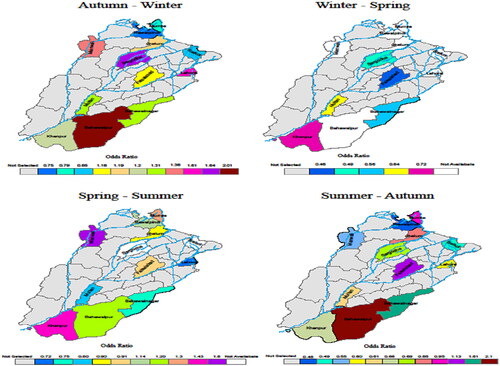
Figure 12. Odds Ratios for varying drought categories in various seasons of the selected stations. Since we used POM to evaluate the odds and probability of drought persistence from one season to the next in the chosen stations by understanding the spatial pattern of seasonal drought frequency and persistence. Therefore, the odds ratios in various drought categories remain the same. Thus, a single odds value represents all drought categories in a specific station and season. The relationship between the drought persistence of the current season to the SPI value of the previous season in the bolded stations is significant.