
Figures & data
Figure 1. Location map of Chingola district in the Copperbelt province of Zambia.
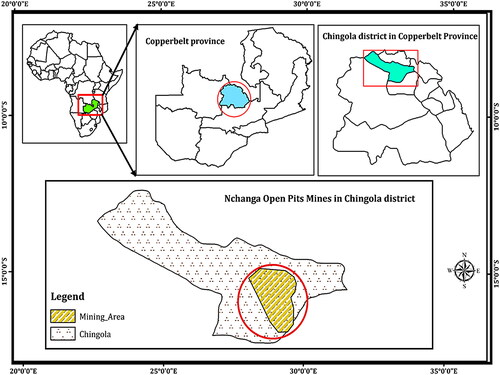
Figure 2. Flowchart of the methodology used in the study.
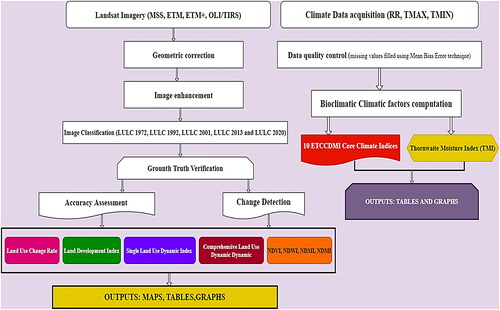
Table 1. List of Landsat images used in the study.
Table 2. Land use and land cover classification scheme considered in this study.
Table 3. Cohen's Kappa statistic nominal scale agreement (Landis and Koch Citation1977).
Table 4. ETCCDMI core climate indices.
Table 5. Climate types corresponding to the Aridity index defined by (UNEP Citation1993).
Table A3. TMI limits with their corresponding Climate type (Thornthwaite, Citation1948).
Figure 3. Land-use and land cover map of Chingola district from 1972 to 2020.
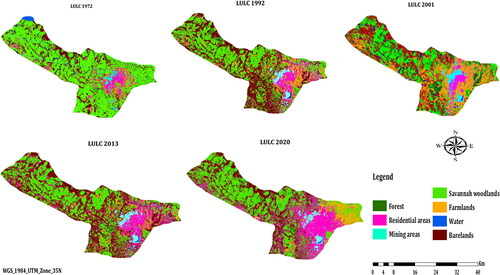
Figure 4. Variation of annual precipitation and monthly maximum consecutive 5-days from 1983 to 2020.
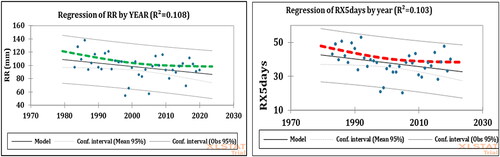
Figure 5. Trend analysis of few climates change detection monitoring indices from 1983 to 2020.
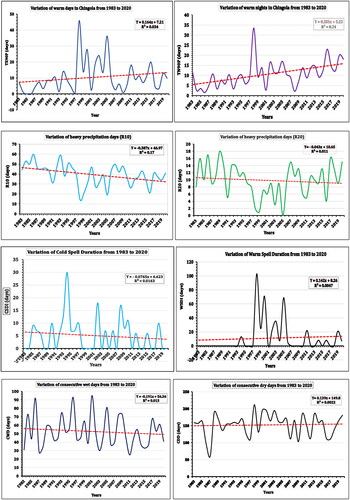
Table 9. Summary of land use and land cover structure index and Comprehensive index.
Table 6. Calculated area of the land cover of Chingola in 1972, 1992, 2001, 2013, and 2020.
Table 7. Land use/land cover change development intensity and annual growth rate from 1972 to 2020.
Table A4. Land use and land cover change transitions between 1972 and 2020.
Table A5. 1972.
Table A6. 1992.
Table A7. 2001.
Table 8. Urban sprawl index (USI).
Figure 6. Patterns of rainfall deficit and surplus observed in Chingola from 1983 to 2020.
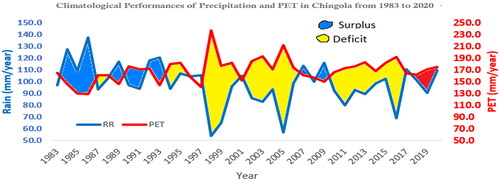
Figure 7. Spatio-temporal variation of NDVI and NDWI in Chingola from 1972 to 2020.
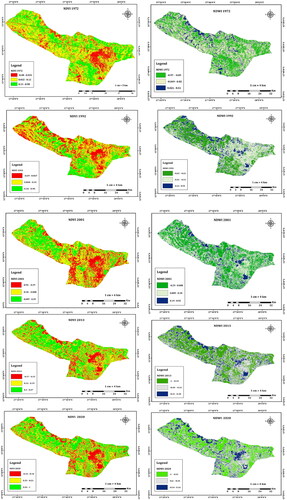
Figure 8. Annual variation of NDVI and NDWI (Max, Mean, and Min) from 1972 to 2020.
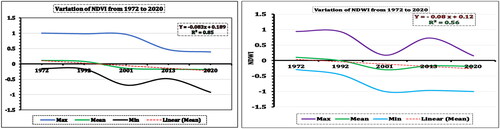
Figure 9. Spatio-temporal variation of NDSI and NDMI in Chingola from 1972 to 2020.
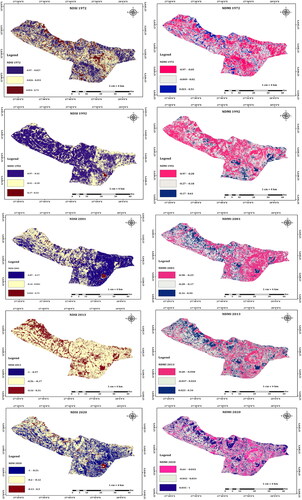
Figure 10. Annual variation of NDSI and NDMI (Max, Mean and Min) from 1972 to 2020.
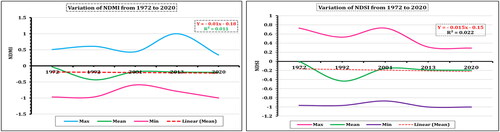
Table 10. Variation of environmental factors.
Table A1. Summary statistics of annual precipitation regression analysis.
Table A2. Summary statistics of RX5days.
Figure A1. Area change intensity heatmap for land use and land cover classes between 1972 and 2020.
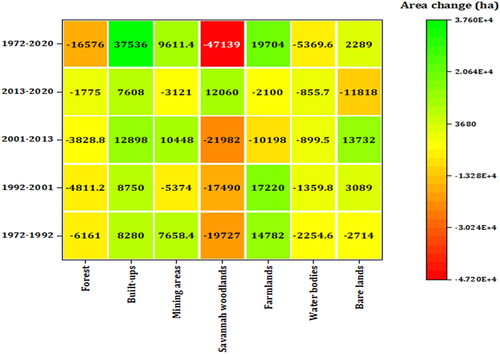
Figure A2. LULC areas change intensity analysis for 1972–2020.
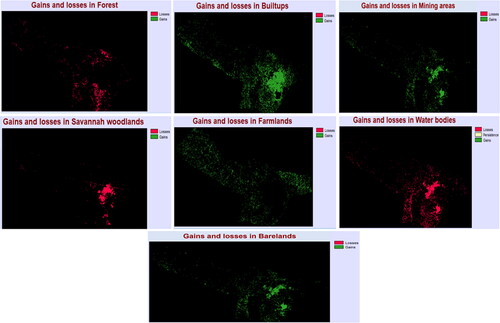
Table A8. 2013.
Table A9. 2020.
Data availability statement
The data and materials that support the findings of this study are freely available from the corresponding author [J.M. Kourouma] and can be shared upon reasonable request.