
Figures & data
Figure 1. The study area of Linhai and the footprints of the SAR and optical images.
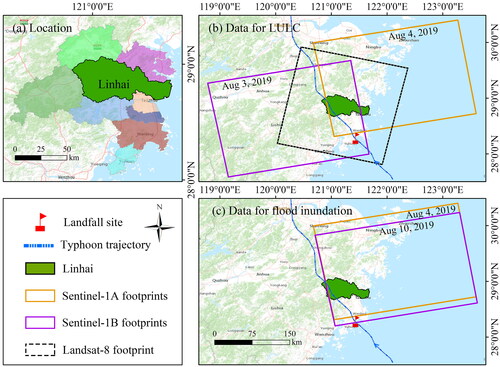
Table 1. The Sentinel-1 SAR and Landsat-8 optical images used in this study.
Figure 2. The training and test sets for LULC classification and flood mapping, where each selected area is highlighted by the subset images of MS, SAR, and Pan (the right panel).
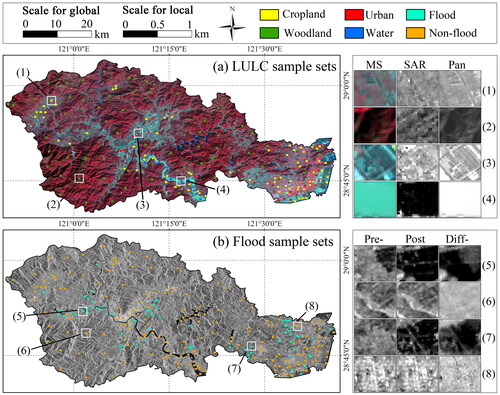
Table 2. The number and percent of the training and test samples for land use classification and flood mapping.
Figure 3. The procedure of LULC mapping, flood mapping, and the consequent damage assessment.
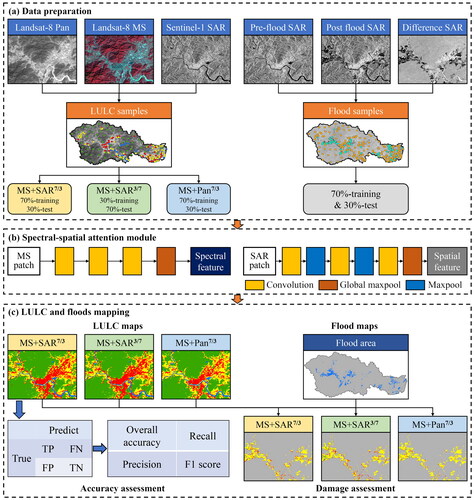
Figure 4. The dedicated CNN structure to manage MS and SAR information for constructing the SoftMax classifier.
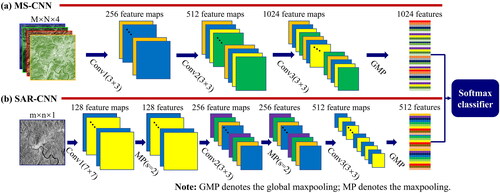
Figure 5. Four LULC maps with an enlarged area to show more details for the three strategies using MultiSenCNN.
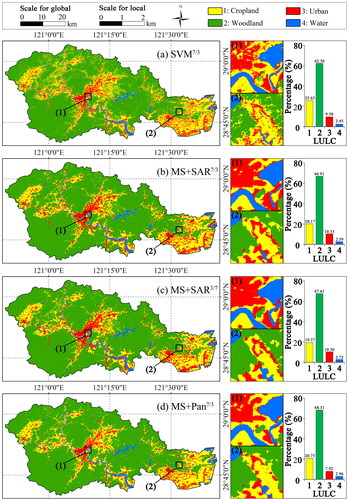
Table 3. Land use classification assessment of MultiSenCNN for the three strategies in Linhai.
Figure 6. The accuracy of the LULC classification varies with the iteration of the algorithms.
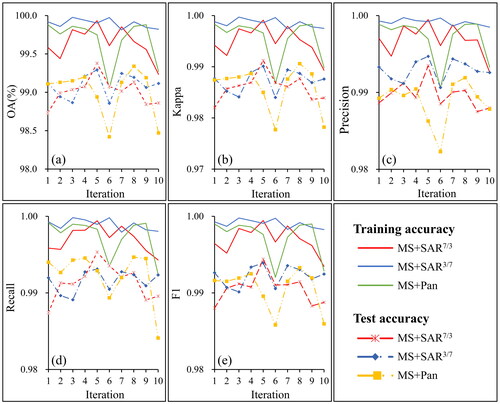
Figure 7. The difference map of the pre-typhoon and post-typhoon SAR images (a), and the classified flood inundation pattern (b–d).
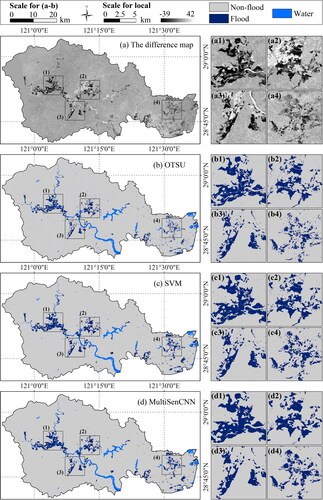
Table 4. Results of the flood identification assessment using the three methods.
Figure 8. The accuracy of the flood identification varies with the iteration of the algorithms.
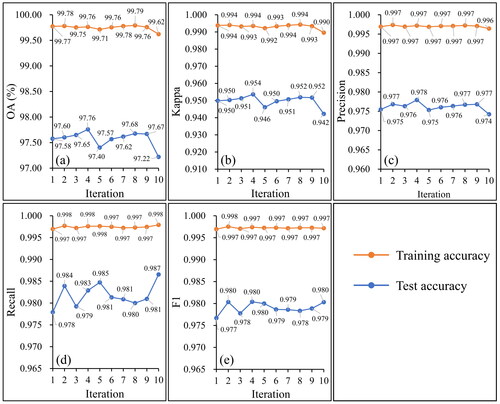
Figure 9. The inundation pattern related to the three LULC types and the corresponding statistics of ESV.
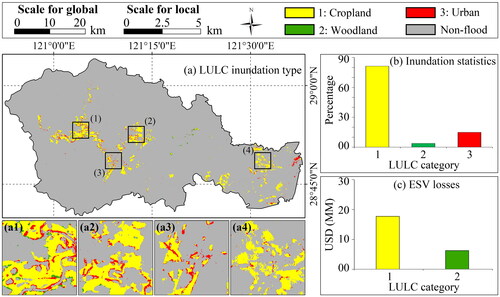
Figure 10. The rainfall patterns of 8–10 August 2019 in Linhai and the estimated flow directions.
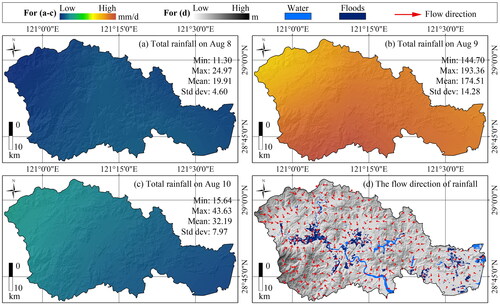
Table 5. The summary statistics of daily average rainfall in Linhai from 5 to 13 August 2019.