
Figures & data
Figure 1. (a) Location of the Three Gorges reservoir area and Badong County. The star indicates the location indication of the study area in the Three Gorges reservoir area. (b) Badong County and ALOS-2 PALSAR-2 images coverage. (c) Shape location of the study area, and the distribution of landslides and water systems in the study area.
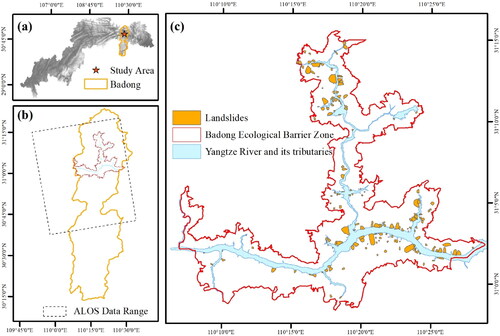
Table 1. ALOS-2 PALSAR-2 images schedule.
Figure 2. Landslide causative factors maps: (a) Elevation; (b) slope; (c) NDVI; (d) lithology groups; (e) TWI; (f) land use/land cover. The lithology groups are described as follows: I: Hard medium to thick-bedded massive dolomite metamorphic conglomerate rock group; II-1: Hard medium to thickly laminated quartz sandstone quartzite fine sandstone rock group; II-3: Hard harder medium to thick-bedded sandstone mud siltstone interbedded with shale coal seams and mudstone shale interbedded rock group; II-4: Harder to softer thinly to moderately thickly bedded shale sandstone mudstone rock group; II-5: Soft thin to medium-thick bedded muddy siltstone shale rock group; III-1: Hard medium to thick-bedded strongly karsted carbonate rock group; III-2: Harder harder medium to thickly bedded strongly to moderately karsted carbonate rock group; III-3: Harder thin to medium-thick bedded weakly karsted carbonate rock group.
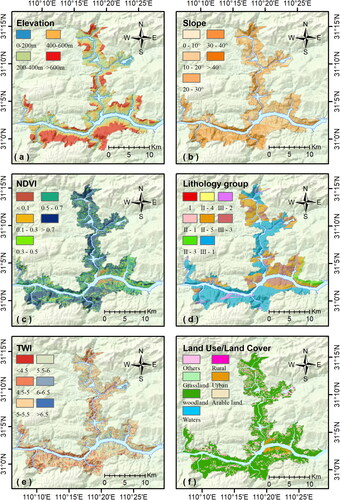
Table 2. Values for each category of causative factors.
Figure 3. Flow chart for identifying potential landslides in Badong based on spatial and temporal filtering of SBAS-InSAR results.
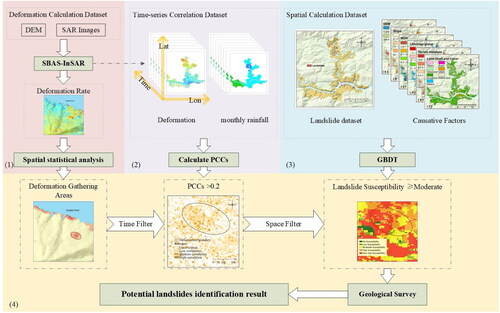
Figure 4. Spatial and temporal baselines of SAR datasets.
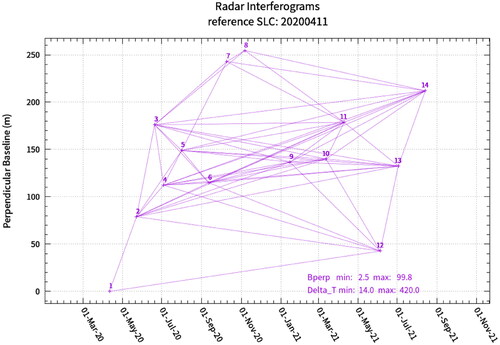
Figure 5. (a) Annual average deformation rate along the radar line of sight direction. The negative value represents the displacement of the target feature away from the satellite direction, which is shown in red in the figure, and the positive value represents the displacement of the target feature close to the satellite direction, which is shown in blue in the figure. (b) Nuclear density map.
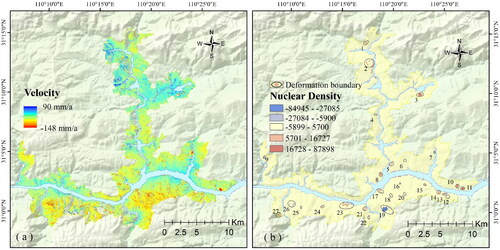
Figure 6. (a–c) The monthly rainfall distributions for April 2020, May 2020 and July 2021, respectively. (d–f) The monthly accumulate deformation for April 2020, May 2020 and July 2021, respectively. n = 10 represents the dates of 10 SAR images.
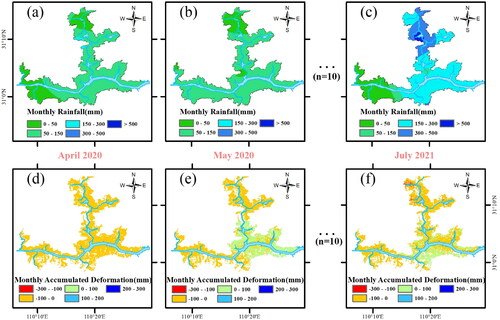
Figure 7. Correlation distribution map. The darker the colour, the higher the correlation between the deformation here and the monthly rainfall.
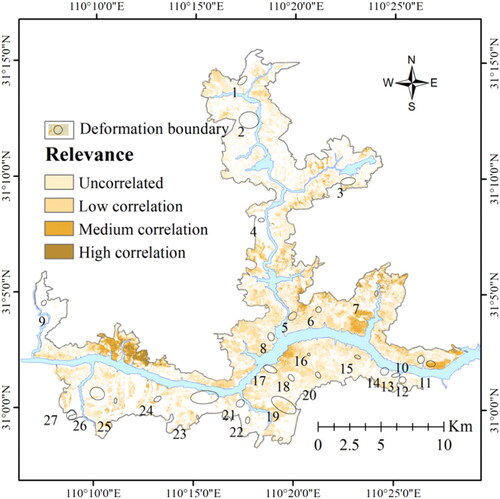
Figure 8. ROC curve for GBDT model.
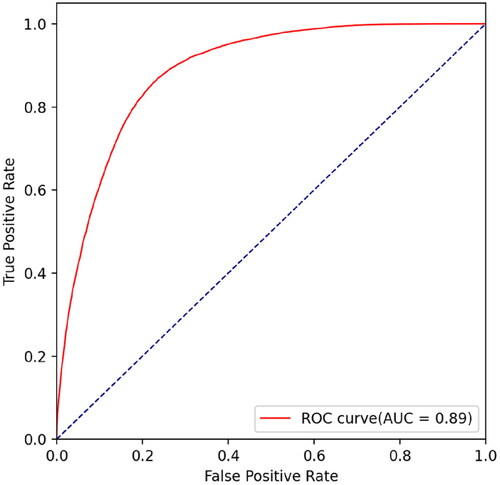
Figure 9. Landslide susceptibility map.
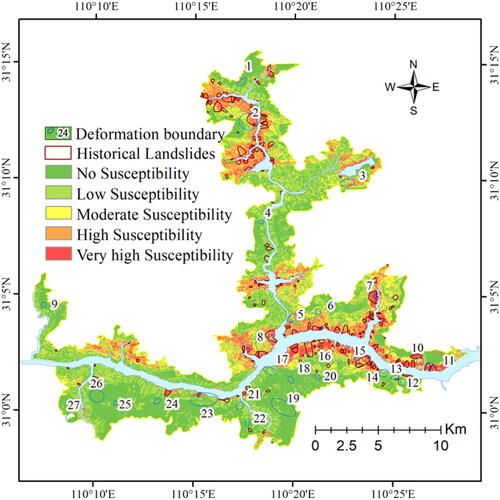
Figure 10. The map of the results of deformation landslides identification.
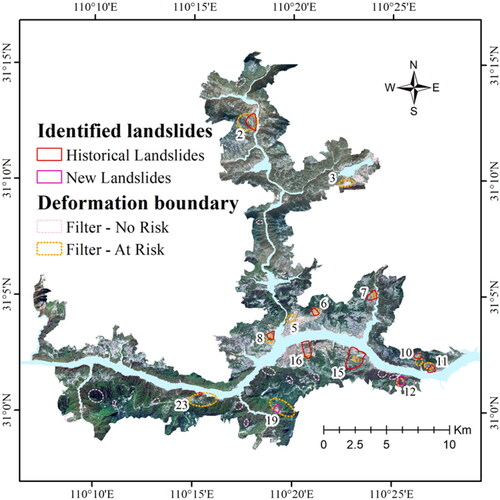
Table 3. Identifying landslides information table.
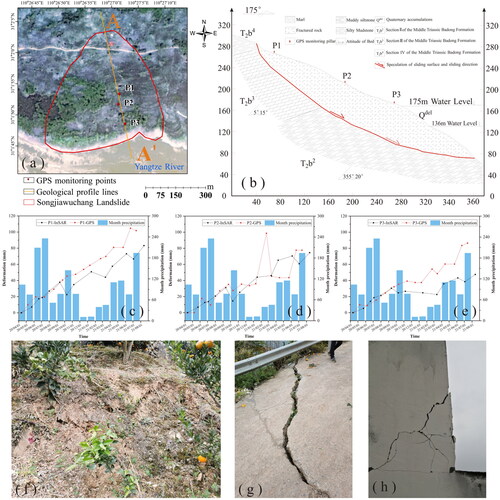
Figure 11. Songjiawuchang landslide deformation analysis figures. (a) The map of the whole landslide and the indication of the location of the A–A′ profile line; (b) the map of the Songjiawuchang landslide profile; (c–e) combined maps of GPS, InSAR, and rainfall; (f–h) geological investigation site maps.
Data availability statement
The data that support the findings of this study are available from the Hubei Geological Environment Station but restrictions apply to the availability of these data, which were used under license for the current study, and so are not publicly available. Data are however available from the authors upon reasonable request and with permission of the Hubei Geological Environment Station.