
Figures & data
Figure 1. Study region in the Northern Shore of Egypt.
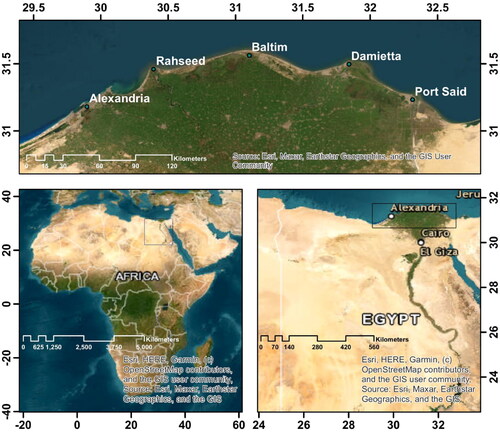
Table 1. A summary of dates, areas, and locations of the raw SAR images used for model training and testing.
Figure 2. The U-Net architecture used for oil spills detection.
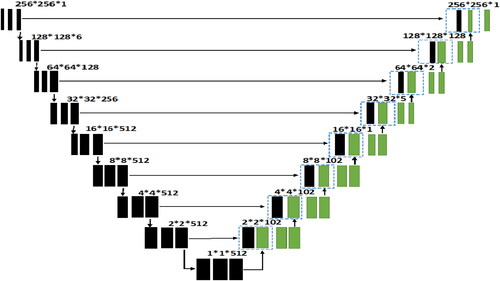
Figure 3. The Seg-Net architecture used for oil spills detection.
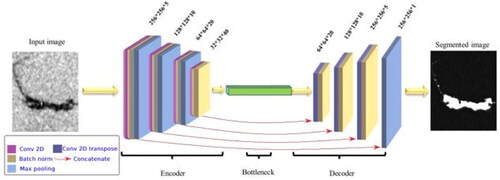
Figure 4. The discriminator architecture used for oil spills detection.
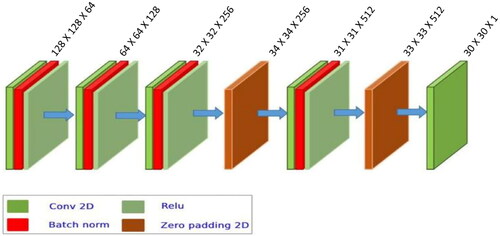
Table 2. Average evaluation parameters after 300 epochs.
Figure 5. Detection results of the four detection models (U-Net, Seg-NET, CGAN, Seg-Net-based CGAN) on different sizes and shapes of oil spill patches from the testing set.
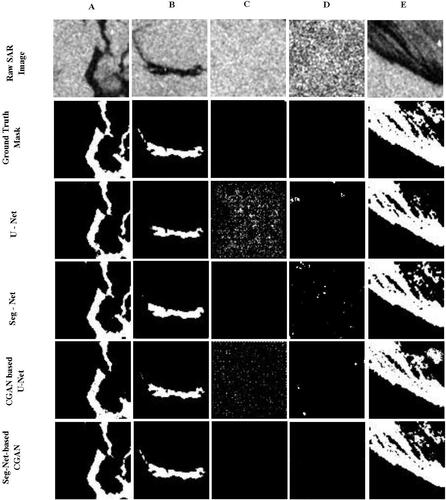
Figure 6. The Proposed Methodology for Oil Spills Detection from raw SAR images using a Seg-Net-based CGAN.
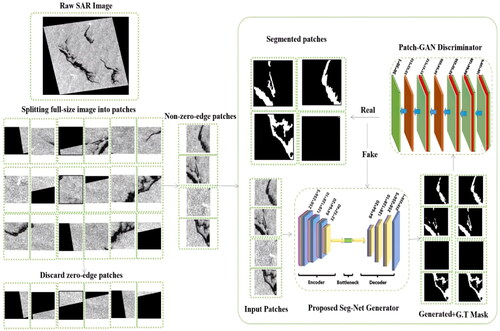
Figure 7. The average detection performance results during training, testing, and validating Seg-Net-based CGAN model using unseen images.
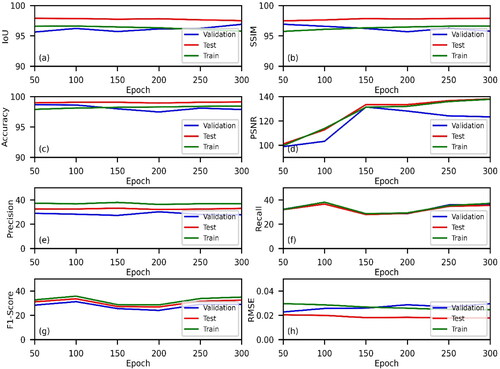
Figure 8. The performance of the proposed Seg-Net-based CGAN model in detecting oil spills during the testing phase.
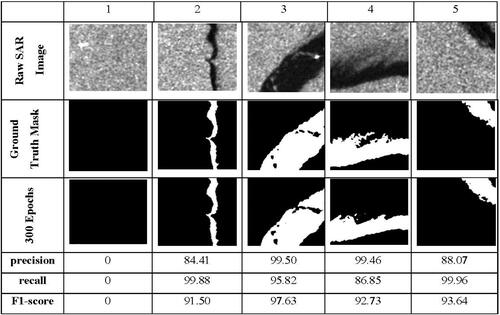
Table 3. The average of evaluation for patches with oil spills only during train, test, and validation of Seg-Net-based CGAN.
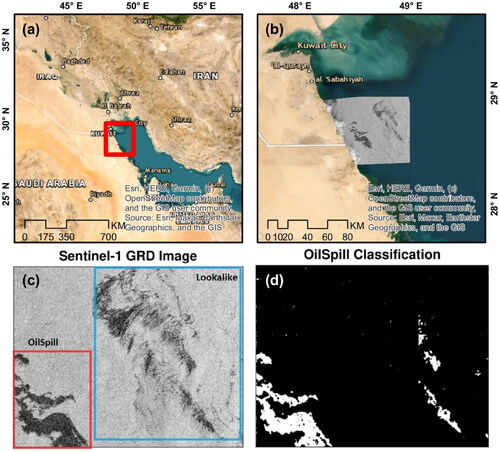
Figure 9. (a) Application region in the Arabian Gulf, (b) location of oil spill at 10 August 2017 overlayed by Sentinel-1GRD (VV) image, (c) Sentinel-1 GRD (VV) image showing the areas of oil spills and lookalikes, (d) results of oil spills segmentation using the proposed model.
Data availability statement
The dataset used in this analysis will be available to the public via https://drive.google.com/file/d/15WYzzFZvAHmqSIW0PXXRTp_YVd_868l8/view?usp=sharing