
Figures & data
Figure 1. Overview of the study area.
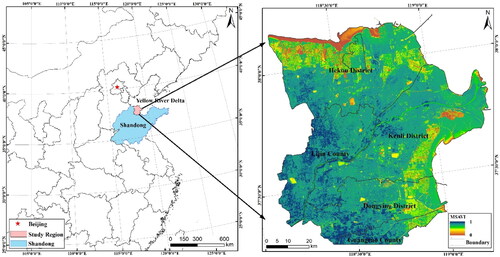
Table 1. List of Landsat images and its detail information.
Figure 2. Principle of Feature space.
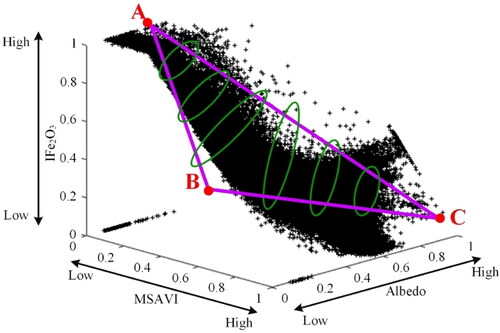
Table 2. Formula of surface parameters.
Figure 3. Three-dimensional feature spaces that composed of different surface parameters (a) MSAVI-Albedo-IFe2O3; (b) NDVI-WI- IFe2O3; (c) NDVI-Albedo- IFe2O3; (d) MSAVI-Albedo-SI; (e) NDVI-Albedo-SI; (f) NDVI-WI-SI; (g) MSAVI-WI-IFe2O3; (h) MSAVI-WI-SI.
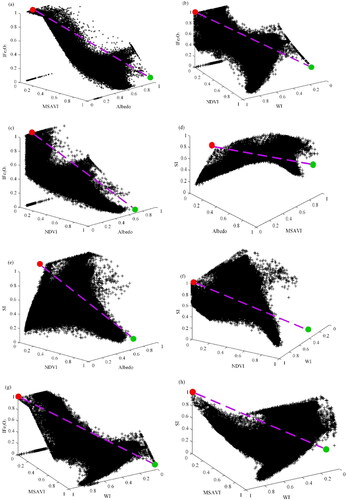
Figure 4. Spatial distribution of levels of soil salinization in three-dimensional feature space. (a) Non salinization; (b) Slight salinization; (c) Mild salinization; (d) Severe salinization.
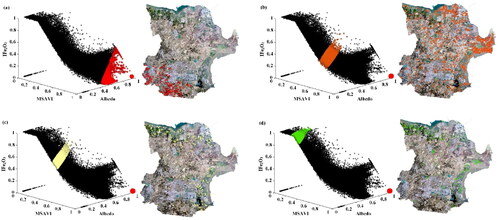
Figure 5. Establishment of 3-D feature space monitoring index model of salinization.
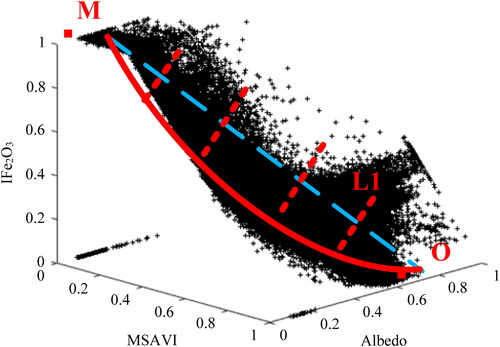
Figure 6. Spatial distribution of different salinization models (a) MSAVI-Albedo-IFe2O3; (b) NDVI-WI- IFe2O3; (c) NDVI-Albedo- IFe2O3; (d) MSAVI-Albedo-SI; (e) NDVI-Albedo-SI; (f) NDVI-WI-SI; (g) MSAVI-WI- IFe2O3; (h) MSAVI-WI-SI.
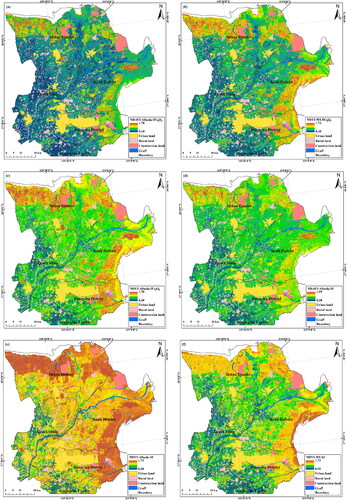
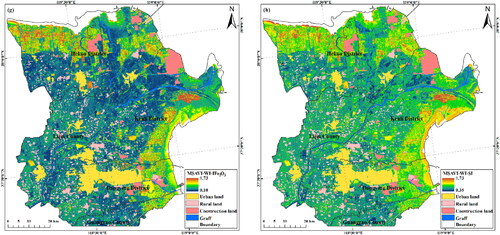
Table 3. Accuracy comparison of different salinization monitoring index models.
Figure 7. Accuracy verification of the feature space model.
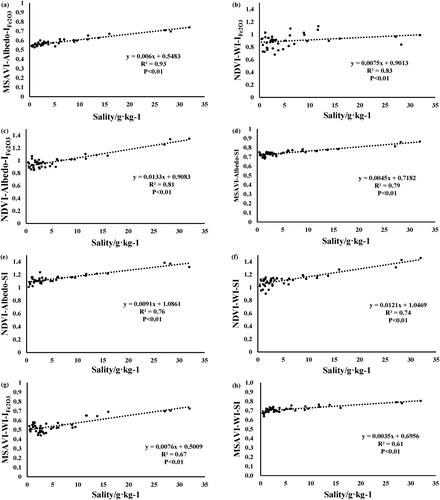
Figure 8. Interannual variation of average salinization monitoring index.
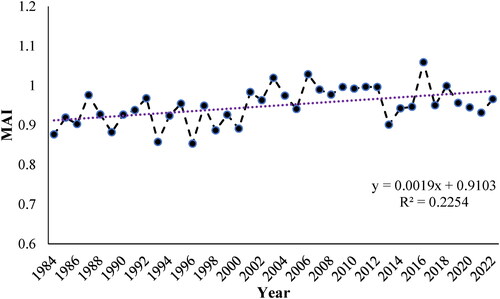
Figure 9. Spatial distribution of salinization in Yellow River Delta.
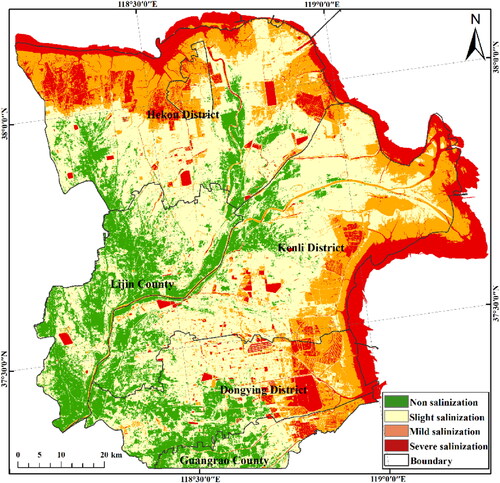
Figure 10. Change trend and intensity of salinization during 1984-2022.
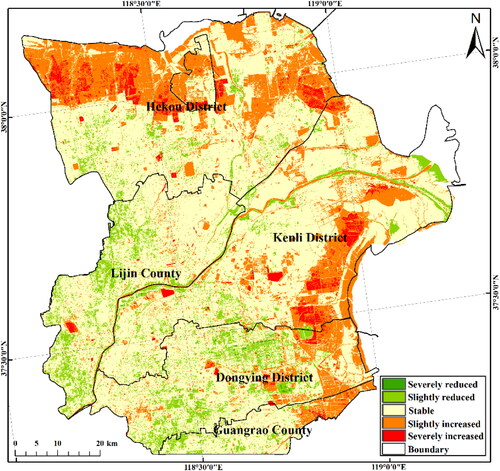
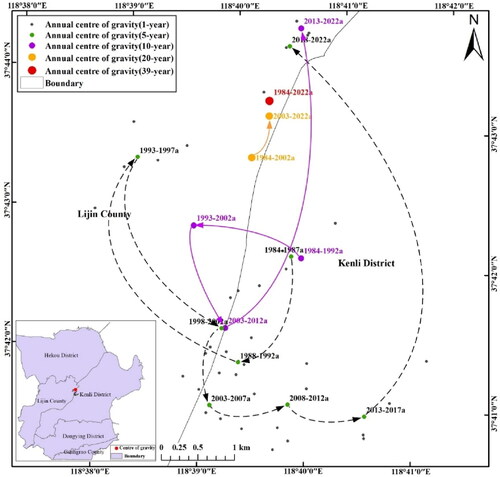
Figure 11. Migration trajectory of salinization gravity center during 1984-2022.
Data availability statement
The data that support the findings of this study are available from the corresponding author, Guo B, upon reasonable request.