
Figures & data
Figure 1. Engineering background; (a) location of Yulong mine, (b) overview of open pit mine, (c) large blocks of bench after blasting, and (d) diagram of the vertical distribution of frozen soil.
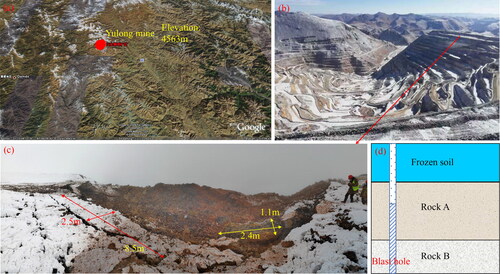
Figure 2. X-ray diffraction analysis results of soil from Yulong mine.
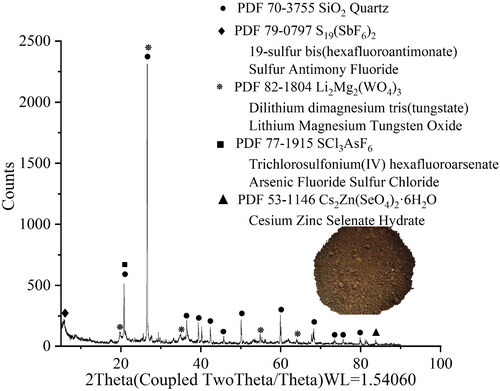
Figure 3. Flow chart of soil sample preparation, freezing, and basic mechanical tests.
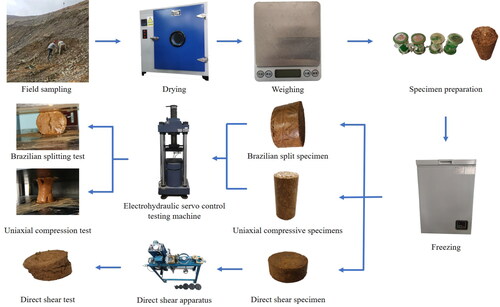
Figure 4. The measurement temperature curve of borehole in Yulong mine.
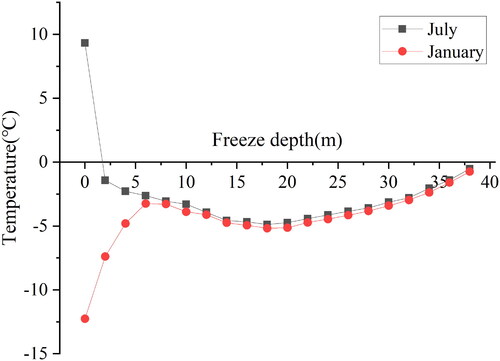
Table 1. Experimental design of mechanical properties of frozen soil.
Figure 5. (a) Variation curves of freezing depth with time and (b) the T2 spectrum of FS with different T.
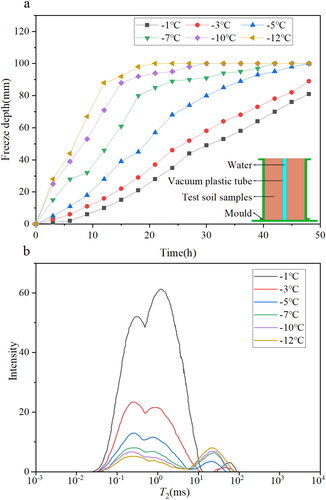
Figure 6. (a) Uniaxial compression stress–strain curves of FS under different T, and (b) variation in UCS, E with T.
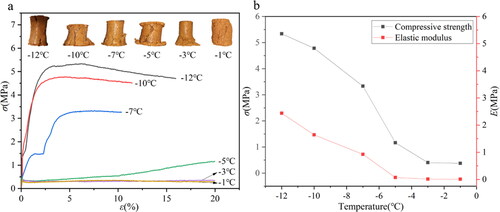
Table 2. Parameter information of test results.
Figure 7. (a) The load-displacement curves of Brazilian splitting tests, and (b) variation in σt with T.
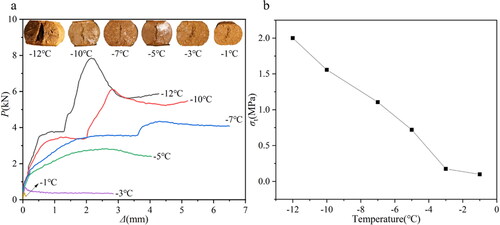
Figure 8. The shear displacement-stress curves of FS with different T, (a–d) for the normal stresses are 100 kPa, 200 kPa, 300 kPa, 400 kPa, respectively.
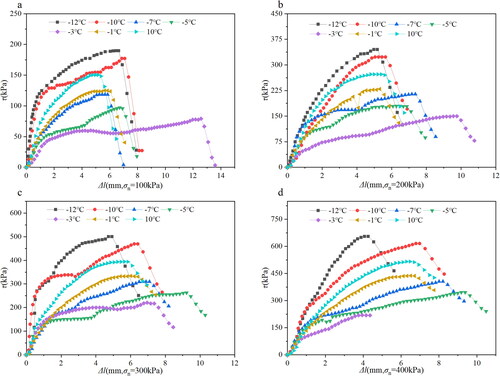
Figure 9. (a) Relationship curve between shear strength and T of FS, and (b) variation in shear strength parameters with T.
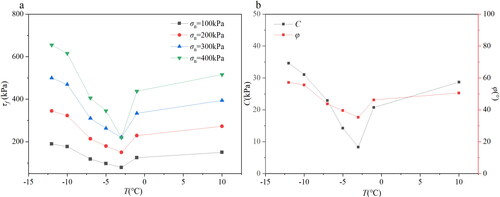
Figure 10. Diagram of soil microstructure; (a) normal state, (b) ice-water mixed state, and (c) frozen state.
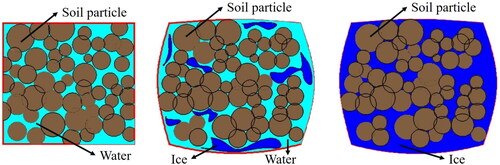
Figure 11. Mechanical model of frozen layer fracture under blasting stress wave; (a) for the natural frozen soil layer, and (b) for the artificial composite frozen layer.
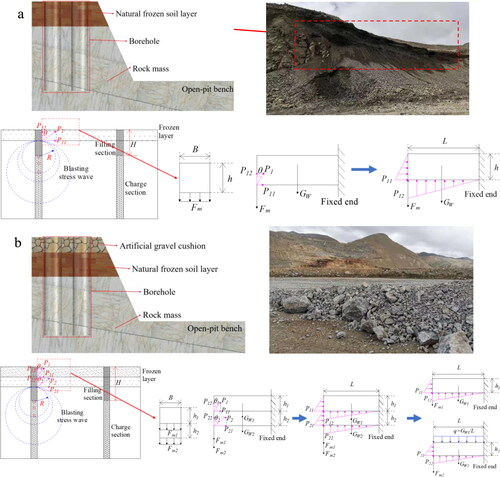
Figure 12. Relationships between FL and thickness of natural frozen soil; (a–d), respectively, for the different f, γ, σt, and P.
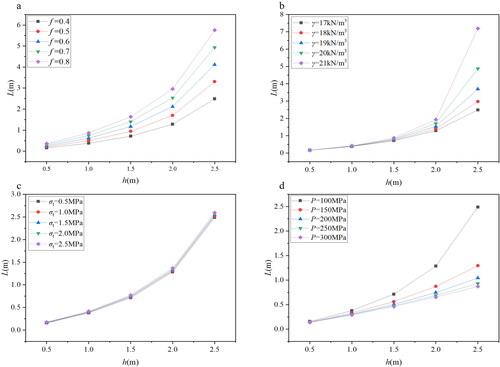
Figure 13. Relationships between FL and thickness of artificial frozen soil layer; (a) h1-L-f1, (b) h2-L-f1, (c) h1-L-f2, and (d) h2-L-f2.
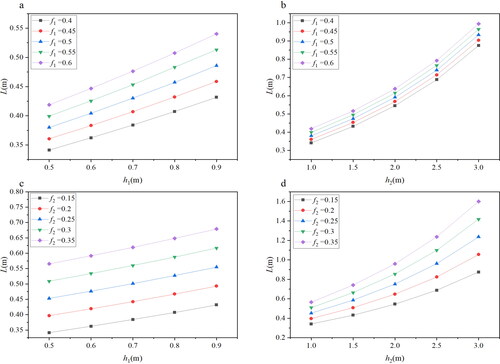
Figure 14. Influence factors of L of FS, (a) and (b), respectively, for the natural and artificial frozen soil layers.
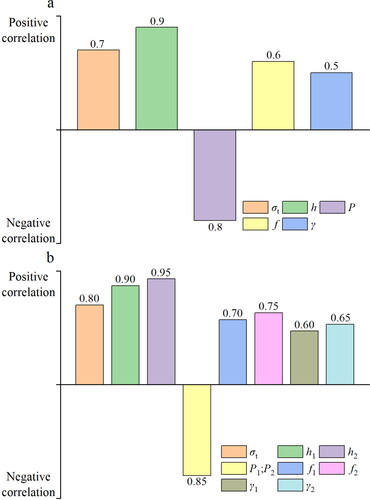
Figure 15. Photographs of field blasting tests, (a) and (b), respectively, for the natural and artificial frozen soil layers.
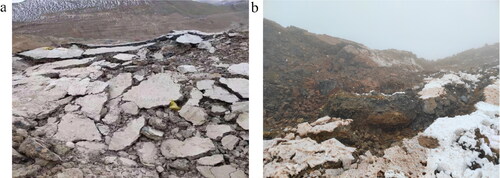
Table 3. Field blasting test parameters.
Date availability
All data used during the study are available from the corresponding author by request.