
Figures & data
Figure 1. The electrode map of the geoelecreic field observation. (a and b): The electrode of parallel triangle; (c and d) : The electrode of internal triangle; (e): The electrode of ‘meter’ type.
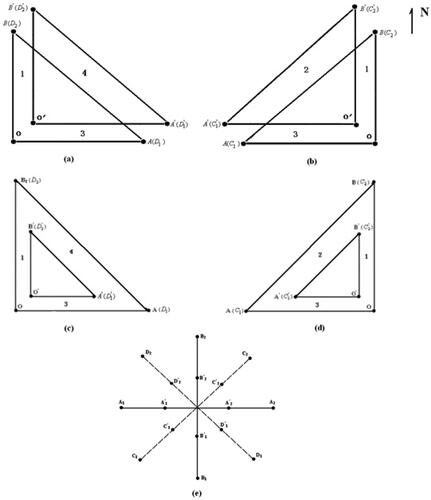
Figure 2. Distribution of 18 geoelectric field stations.
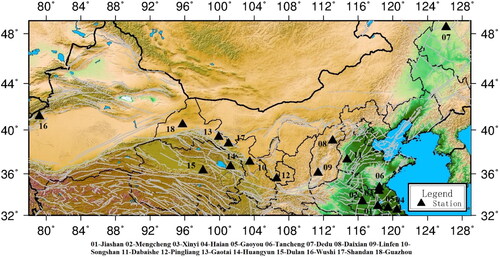
Figure 3. Observations from Dulan (15) station on Sept. 10, 2017. (a) Geomagnetic field H-component (b) Geoelectric field Ey-component long channel. (c) Geoelectric field Ey-component short channel
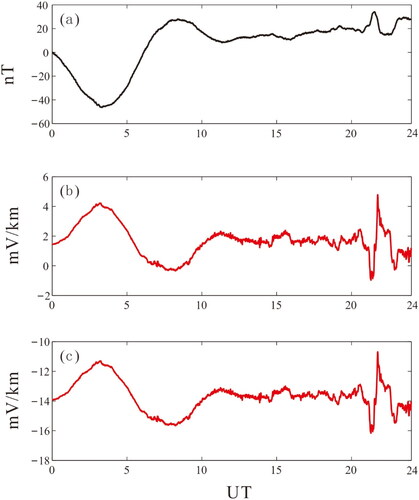
Figure 4. The calculation flow diagram.
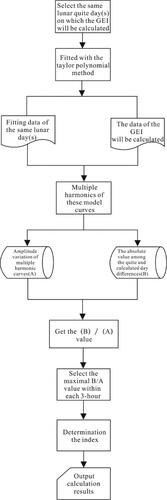
Table 1. The scale of D index.
Figure 5. Geoelectric and geomagnetic indices of the 18 stations on 1 September 2017 (The graphs of a b c are the results calculated by the three calculation methods, the graph d is the result calculated by the K index. a- original method b- attempt 1 c- attempt 2).
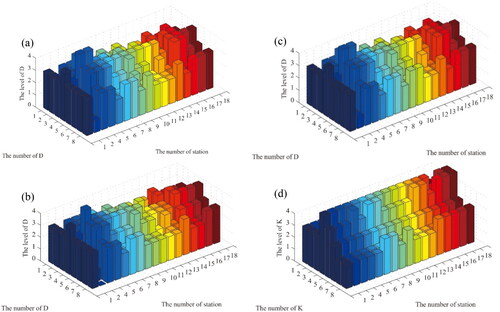
Figure 6. Frequency Distribution of Geoelectric Index and Geomagnetic Indices of the 18 stations in September 2017(original method). (a) Index D; (b) Index Ds; (c) Index K; (d) Index .
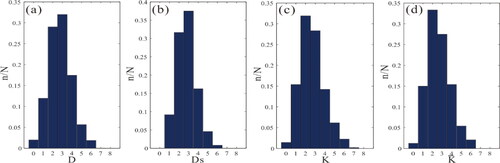
Table 2. Geoelectric and geomagnetic indexes of the 18 stations on Sept. 1, 2017(original method, attempt 1, attempt 2. Those marked in yellow are the indices with differences in calculation.).
Table 3. Geoelectric and Geomagnetic Indexes of the 18 stations on Sept. 5, 2017(original method, attempt 1, attempt 2. Those marked in yellow are the indices with differences in calculation.).
Figure 7. Frequency distribution of geoelectric and geomagnetic indices of the 18 stations in September 2017(attempt 1). (a) Index D; (b) Index Ds; (c) Index K; (d) Index .
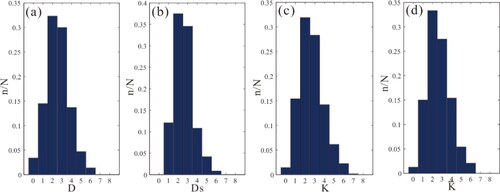
Figure 8. Frequency distribution of geoelectric and geomagnetic indices of the 18 stations in September 2017(attempt 2). (a) Index D; (b) Index Ds; (c) Index K; (d) Index .
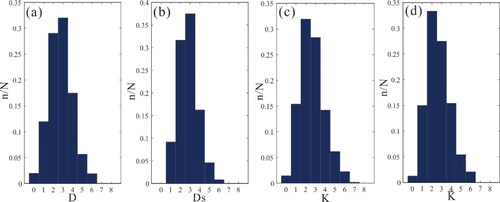
Table 4. The same or similar ratio of the three calculation methods.
Data availability statement
The data that support the findings of this study are available from the first author, Junsong Sun, upon reasonable request.