
Figures & data
Figure 1. Location and topography of the study area.
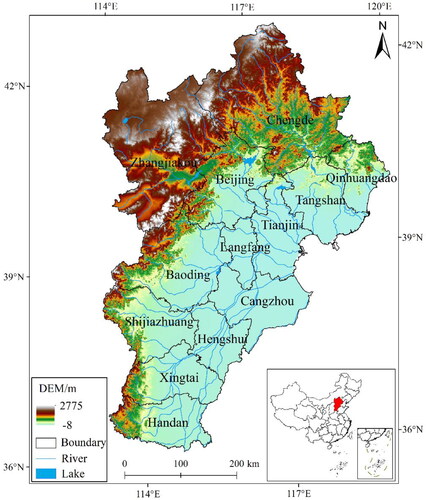
Table 1. Carbon density of different vegetation types.
Table 2. Data introduction.
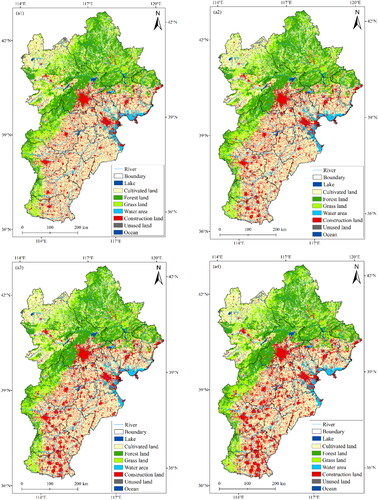
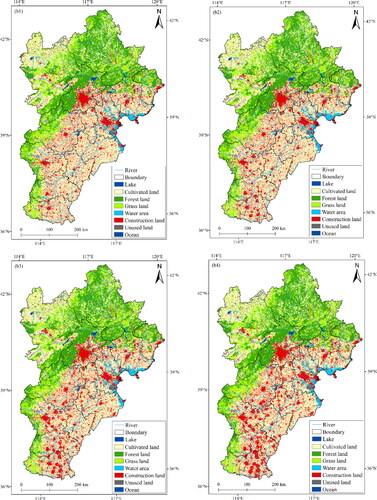
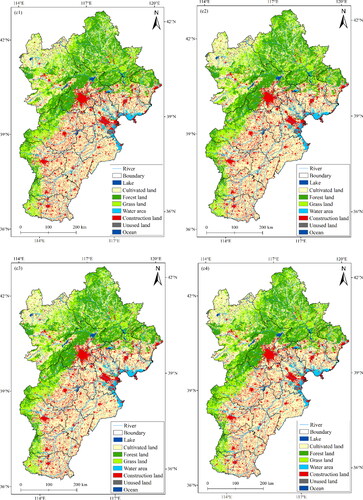
Figure 3. Spatial distribution of carbon storage from 1990 to 2020. (a) 1990; (b) 2000; (c) 2010; (d) 2020.
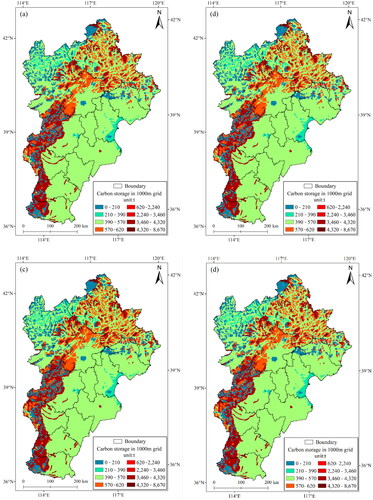
Figure 4. Change of carbon storage in different regions. (a) 2000–2010; (b) 2010–2020.
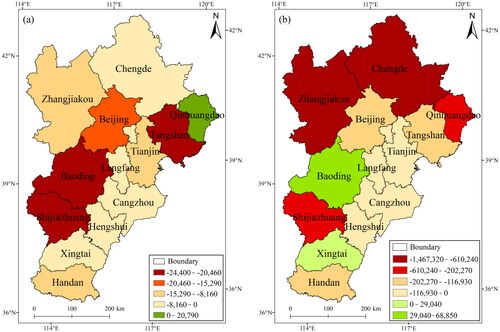

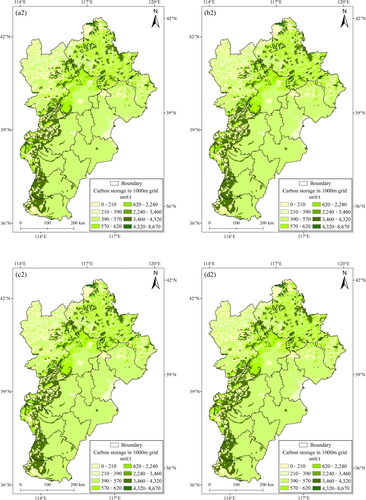
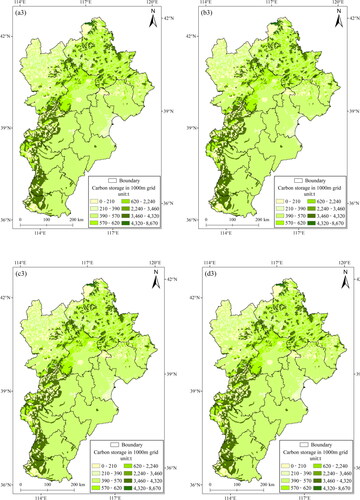
Figure 6. Change of carbon storage in 2030-2060 under multiple scenarios.
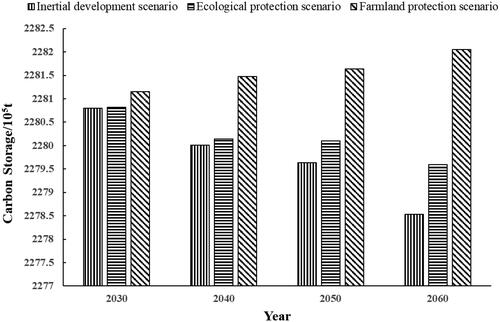
Figure 7. Change of carbon storage under the inertial development scenario. (a) 2020–2040; (b) 2040–2060.
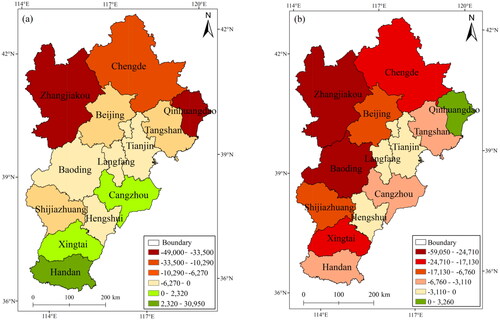
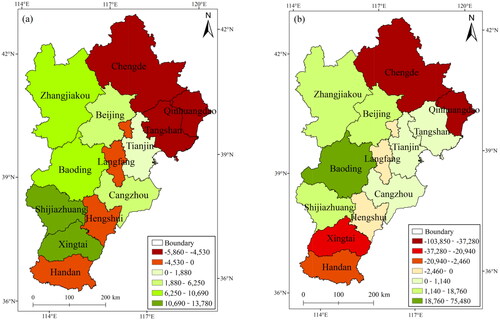
Figure 8. Change of carbon storage under the ecological protection scenario. (a) 2020–2040; (b) 2040–2060.
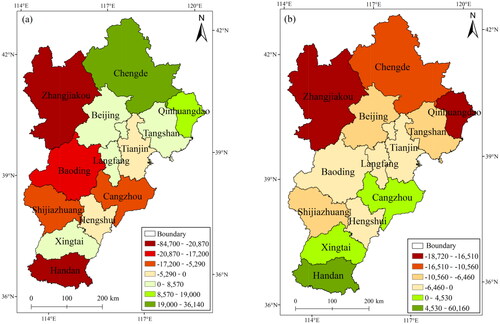
Figure 9. Change of carbon storage under the farmland protection scenario. (a) 2020–2040; (b) 2040–2060.
Data availability statement
The data that support the findings of this study are available from the corresponding author, Guo B, upon reasonable request.