
Figures & data
Figure 1. The geographical locations selected for the current analysis.
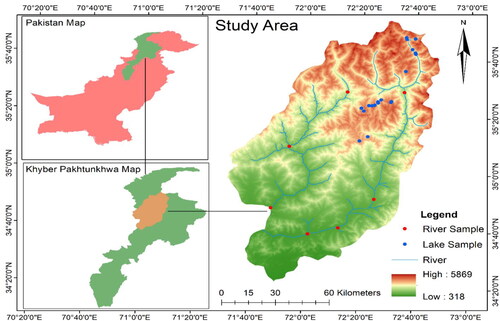
Table 1. Descriptive statistics of Physicochemical & Heavy metals of observed samples.
Table 2. Categorization of water on the basis of WQI.
Figure 2. Variogram envelope for WQI without Trend.
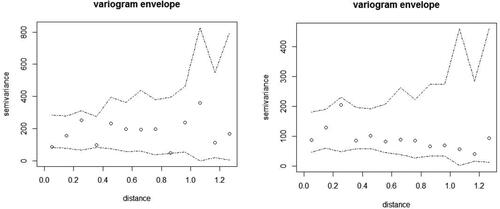
Figure 3. Circular variogram fitted to emperical variogram for OK and powered exponential variogram fitted to empirical variogram for UK.
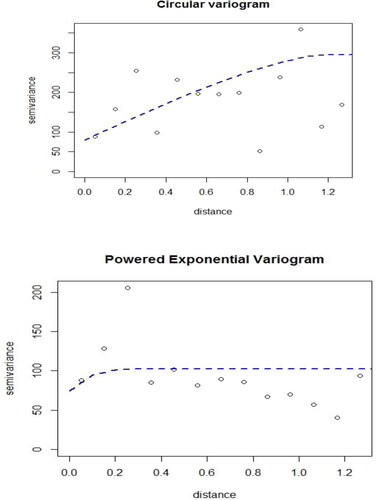
Figure 4. Prediction map of WQI by using OK and prediction error map of WQI by using OK.
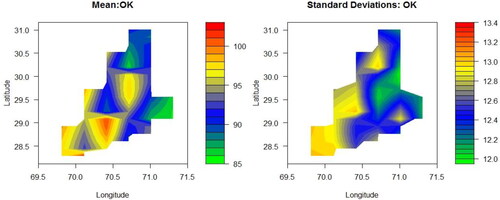
Figure 5. Prediction map of WQI by using UK and prediction error maps of WQI by using UK.
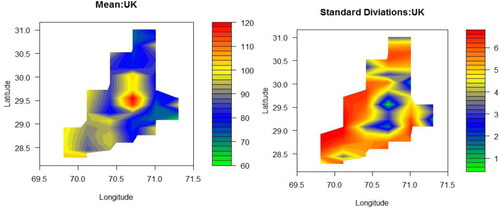
Table 3. Prediction techniques with their corresponding RMSPE.
Data Availability statement and codes
The data and codes used for the preparation of the manuscript are available with the corresponding author and can be provided upon request.