
Figures & data
Figure 1. The study’s target blazes; a) from the Victoria, Australia database of forest fire from 2019–2020, b) from the Margalla Hills, Pakistan database from 2019 and 2020.
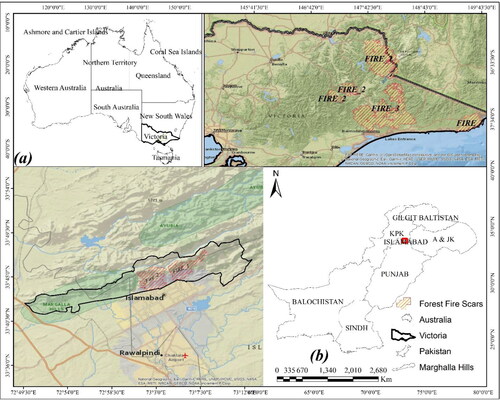
Table 1. Explanation of fire zones in Victoria, Australia and Margalla Hills, Islamabad, Pakistan.
Table 2. A description of the fire zones in the Australian and Pakistan.
Figure 2. The process flow for the actualized procedure, using open-source software and time-lapse data from Sentinel-1 and Sentinel-2.
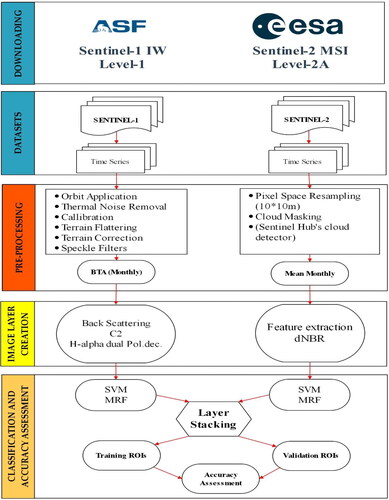
Figure 3. dNBR from Sentinel-2 of fire zones: a) Aus_f_1, b) Aus_f_2, c) Aus_f_3 and d) Aus_f_4, respectively of Victoria, Australia.
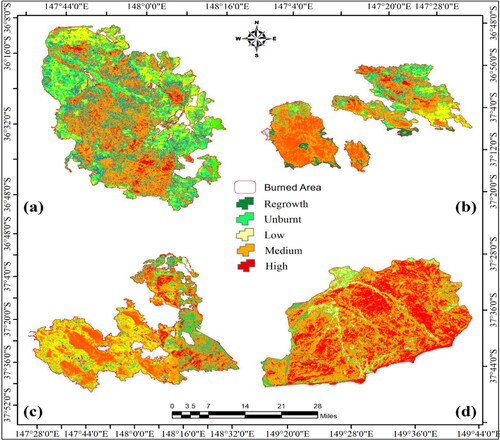
Figure 4. Australian fire zones a), Aus_f_1, b), Aus_f_2, and c), Aus_f_3, and d) Aus_f_4 were classified using SVM from Sentinel-2 imagery. Area created by the burnt ratio index is depicted as bushfires in .
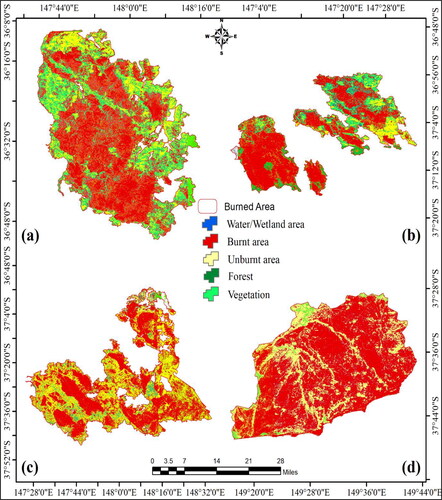
Figure 5. Sentinel-2 dNBR of fire zones (a) Pak_f_1 and (b) Pak_f_2 in Pakistan, respectively. Calculated by comparing pre-and post-fire images to show improvements in the region affected by forest fires.
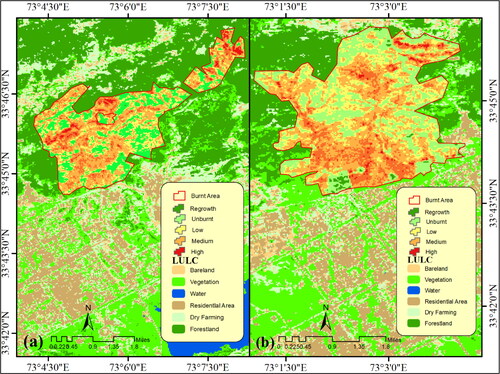
Table 3. Findings of SVM (%) and SVM_MRF(%) classification for the optical and radar kappa coefficients covering Australia and Pakistan.
Figure 6. Boxplots showing the VH coefficient backscatter intensity predictable beside the local angle of incidence of south eastern Australia, comparing the pre and post-image of fire.
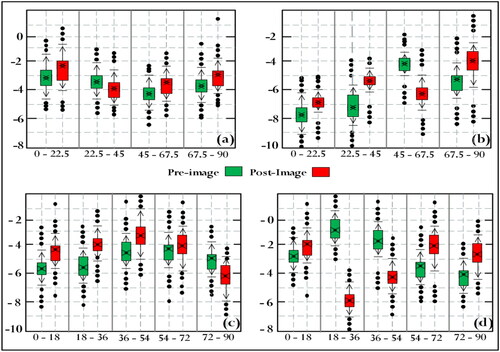
Table 4. Results of the accuracy evaluation based on kappa statistics from the Sentinel-2 fire zone Australia and Pakistan using SVM-MRF classification.
Table 5. Results of the accuracy assessment using Sentinel-1 SVM-MRF classification covering fire zones in Australia.
Table 6. The findings of the accuracy evaluation are based on measurements of F-score from the Sentinel-2 classification of SVM MRF covering Pakistan fire.
Supplemental Material
Download MS Word (6.6 MB)Data availability statement
The data presented in this study are available on request from the first or corresponding authors.