
Figures & data
Figure 1. Study area map. The boundary of Dar es Salaam is delineated from OpenStreetMap. The data of the built up areas is found from GitHub (Dooley et al. Citation2020).
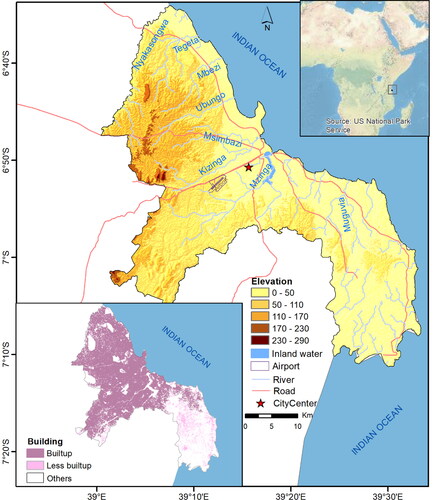
Figure 2. Climate of the study area. Date source: CLIMATE-DATA.ORG.
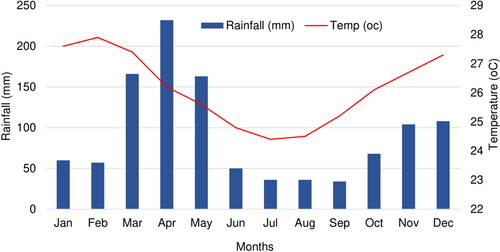
Figure 3. Flow diagram of the methodological approaches used.
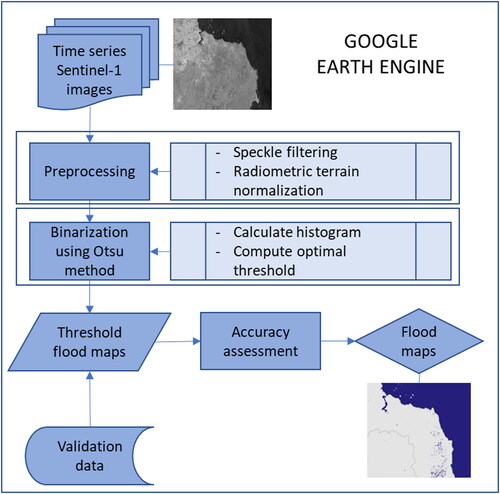
Figure 4. (A) Footprints of Sentinel-1 (a, b) for May 2021 in Dar es Salaam. (a) Sentinel-1A including three images captured on 05, 17, and 29 May, (b) Sentinel-1B covering about 90% of the city with two images captured on 08 and 20 May, (c) Sentinel-1B covering only southeastern half of the city with three images captured on 03, 15, and 27 May, and (d) overlap of all repeat Sentinel-1A and B images, and (B) temporal distribution of the Sentinel-1A and B images in Dar es Salaam.
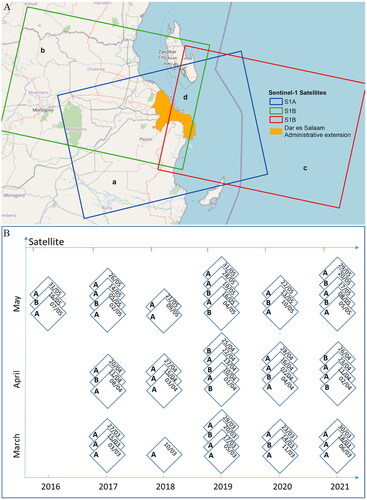
Figure 5. Histograms of the single co-polarization (VV) intensity images that cover Dar es Salaam over the period from 01 March–31 May 2021 presented as a sample representation to show the pattern of the sigma VV values (dB) over the images. S1A refers to Sentinel-1 A, and S1B refers to Sentinel-1 B.
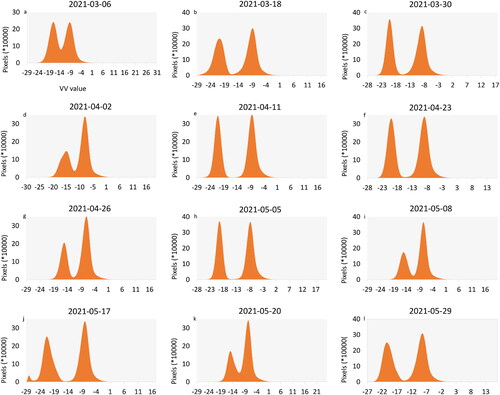
Figure 6. Representative threshold charts of the co-polarization (VV) intensity values over the period from 01 March–31 May 2021. The vertical lines indicate the thresholds that separate water and non-water surfaces. The satellite (A/B) is as presented in .
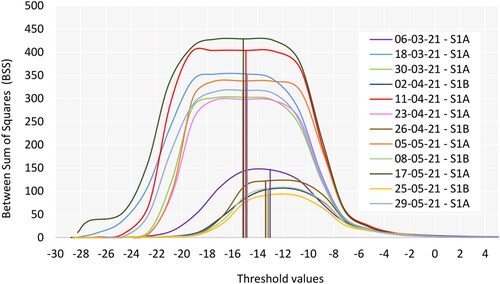
Figure 7. Distribution of threshold values of the Sentinel-1 C-band GRD VV polarization images for the period 2016–2021 (n = 55).
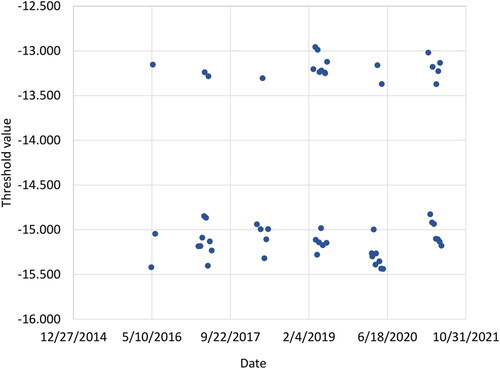
Figure 8. Binarized Sentinel-1 images of a few dates that fully cover Dar es Salaam in 2021. The randomly generated validation points are included in the last map.
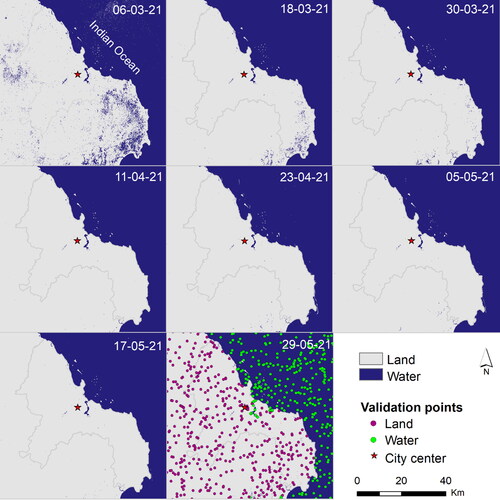
Table 1. Accuracy assessment result of the binarization of water and land.
Figure 9. Flooded areas in Dar es Salaam in 2021, presented as representatives.
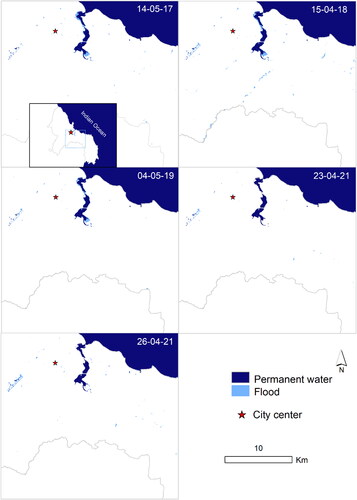
Table 2. Flood inundated areas (km2) in Dar es Salaam (2016–2021).
Table 3. Historical flood records in Dar es Salaam region reported from various sources (source: FloodList – https://floodlist.com/?s=dar+es+salaam&submit=).
Figure 10. Flood frequency in Dar es Salaam from 2016–2021 rainy seasons.
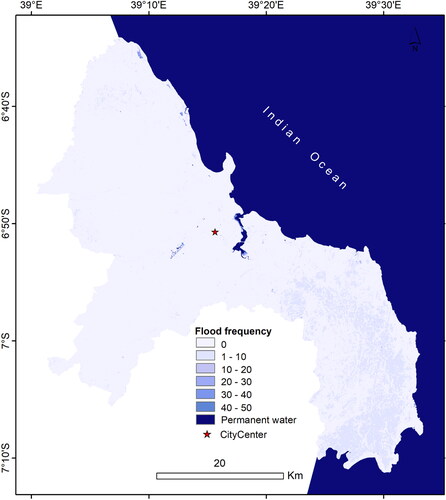
Figure 11. Flood inundation under different land cover types.
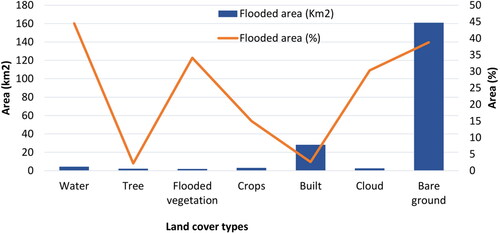
Figure 12. Spatial distribution of flood inundation in relation to different land cover types.
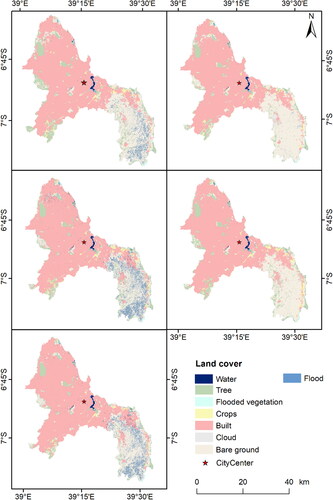
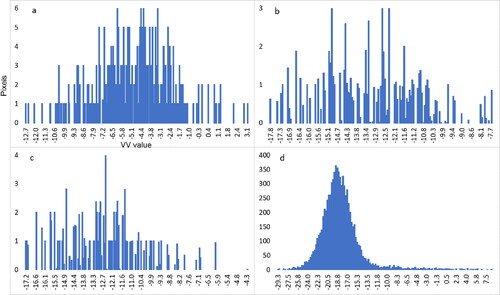
Figure 13. Histogram of VV backscatter values for builtup (a), channelbed (b), floodplain (c), and waterbody (d).
Availability of data and materials
Data are available and can be provided when required.
Code availability
Data were processed using the GEE cloud computing. The GEE codes can be available after accepted for publication.