
Figures & data
Figure 1. Map of Pakistan with the study area highlighted in red and map showing the elevation, fault lines, and waterways of the studied area.
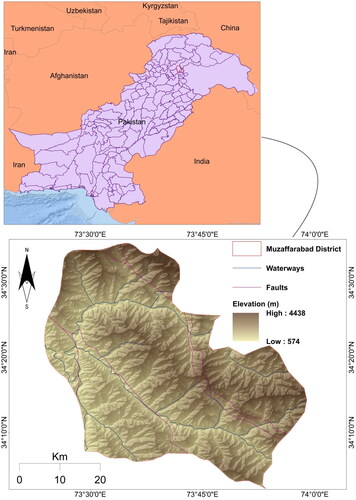
Figure 2. Methodological flowchart of the study showing all the important steps and sequence of the work.
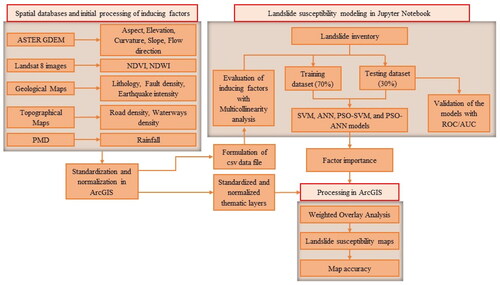
Figure 3. The general structure showing different kinds of layers and learning mechanism of ANN as an MLP.
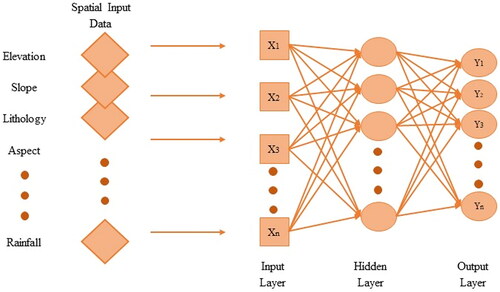
Table 1. Multicollinearity analysis of landslide inducing factors.
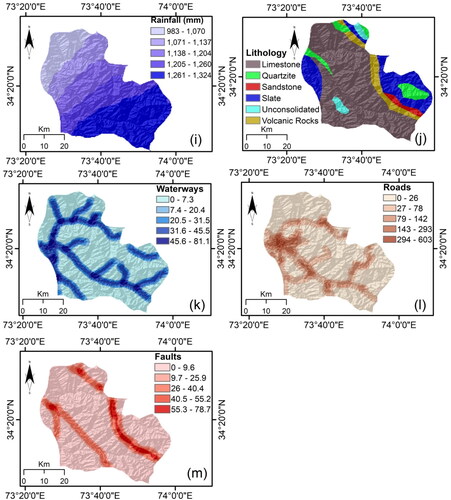
Table 2. Obtained relative importance of landslide inducing factors from different models.
Figure 5. Formulated landslide susceptibility maps using SVM (a), ANN (b), SVM-PSO (c), and ANN-PSO (d) models.
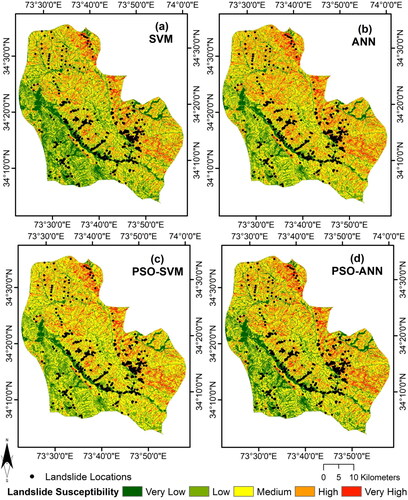
Table 3. Area division of landslide susceptibility types generated from different models.
Figure 6. The ROC curves of the used models obtained for the testing dataset.
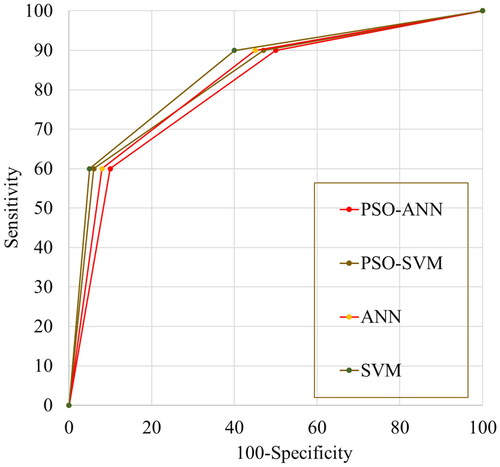
Table 4. Outcomes of accuracy assessment of the generated maps from different models.
Availability of Data
The data that support the findings of this study are available on request from the corresponding author.