
Figures & data
Figure 1. Location of the study area and distribution of landslides along the Jinsha River.
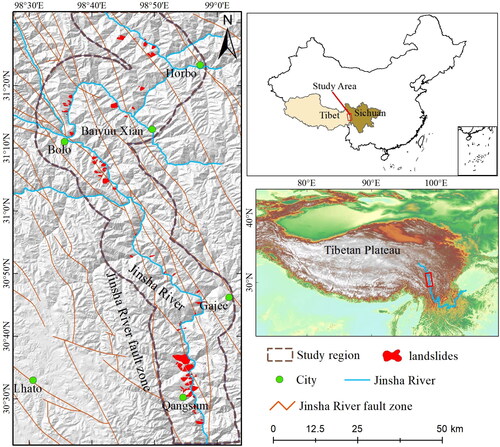
Figure 2. Examples of landslides identified by geomorphic features and InSAR deformation results.
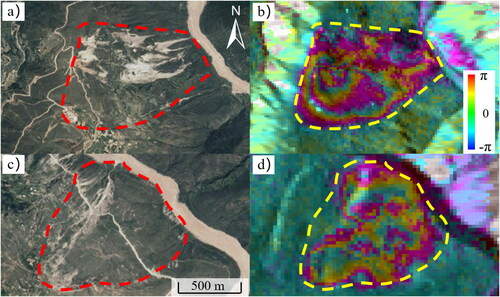
Table 1. Landslide-related environmental factors categories in the study area.
Table 2. Detail parameters of SAR images.
Figure 3. Research methodological flow of the study.
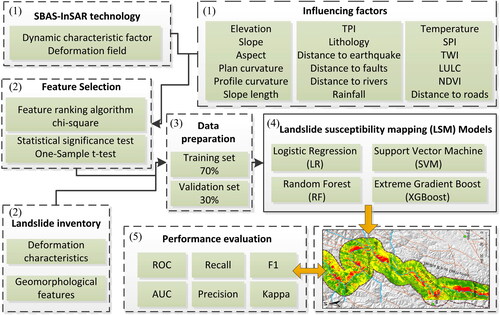
Figure 4. Landslides-influencing factors. (a) dem, (b) aspect, (c) slope, (d) plan curvature, (e) plan curvature, (f) slope length, (g) TPI, (h) lithology, (i) distance to earthquakes, (j) distance to faults, (k) distance to rivers, (l) rainfall, (m) temperature, (n) SPI, (o) TWI, (p) LULC, (q) NDVI, (r) distance to roads, (s) LOS deformation acquired from ascending images, (t) LOS deformation acquired from descending images.
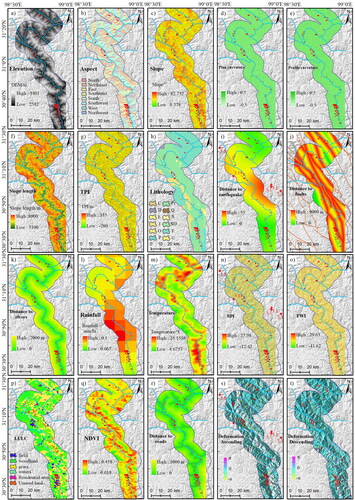
Figure 5. Correlation coefficient of each covariate based on Wilcoxon signed-rank test.
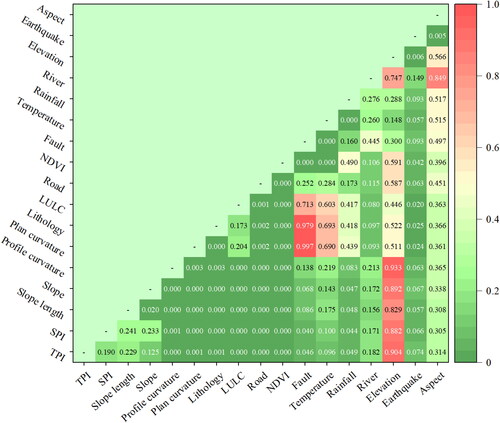
Table 3. Detail feature importance’s calculated by four ranking algorithms.
Figure 6. Landslide susceptibility mapping generated by logistic regression, random forest, SVM, and XGBoost models. (a–d) LSM without considering deformation, (e–h) LSM considering deformation.
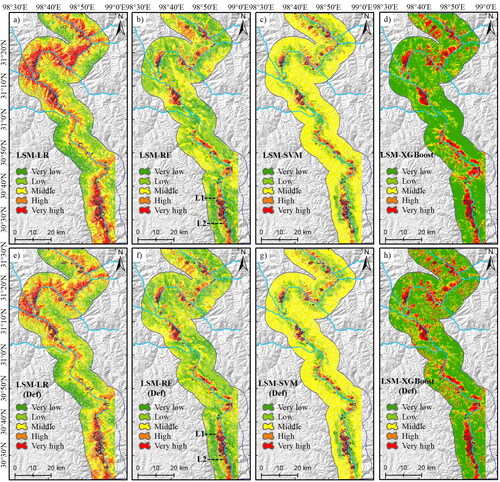
Table 4. Statistical pixel values of landslide susceptibility before and after the introduction of deformation.
Table 5. Statistical pixel values of landslide susceptibility in landslide area before and after deformation introduction.
Figure 7. Typical regional susceptibility optimization results. (a–d) the susceptibility results and deformation information of L1 landslide (marked in ), a random forest susceptibility results without considering deformation, (b) random forest susceptibility results considering deformation. (e–h) The susceptibility results and deformation information of L2 landslide (marked in random forest susceptibility results without considering deformation, (f) random forest susceptibility results considering deformation.
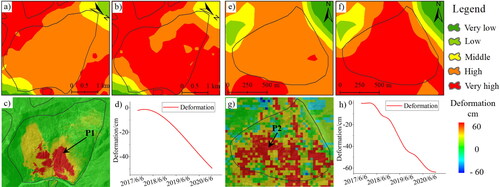
Figure 8. ROC curves of four susceptibility models. (a) ROC test without considering deformation characteristic factors, (b) ROC test considering deformation characteristic factors.

Table 6. Statistical confusion matrix of the four susceptibility models.
Figure 9. Significance of landslide-related environmental factors of the study area predicted by XGBoost and random forest models.
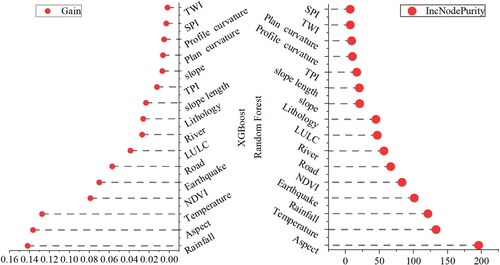
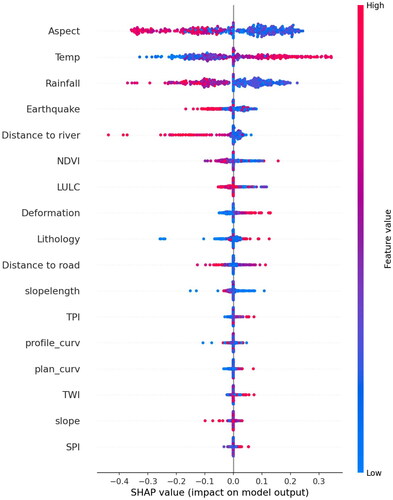
Figure 10. Summary plot of SHAP values derived from RF model.
Data Availability Statement
Sentinel-1A data used in this study were provided by European. Space Agency (ESA) through the Sentinel-1 Scientific Data Hub.