Figures & data
Figure 1. Map of Longyan city center, including its location, rivers, buildings and roads.
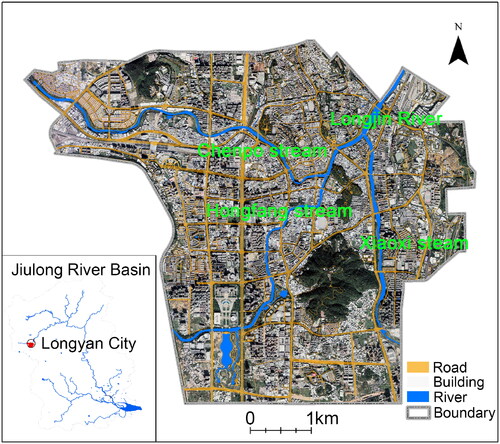
Figure 2. Framework for compound flood simulation and impact assessment.
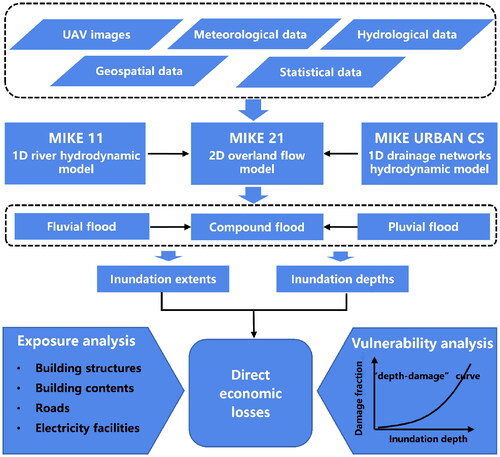
Table 1. Data sources for compound flood simulation and impact assessment.
Table 2. Maximum hourly precipitation for a short-term rainfall and a long-term rainfall.
Figure 3. Design rainstorm distribution process for different return periods.
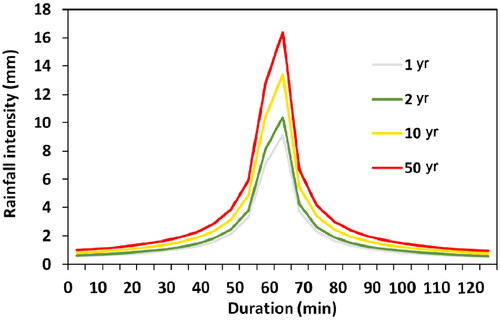
Table 3. Validation of the SWAT model.
Table 4. Validation of the MIKE 11 HD model.
Table 5. Performance of the pluvial flood model.
Table 6. Vulnerability curves for building, road and Electricity facility.
Figure 4. Maximum inundation extents and depths in the cases of (a) 1-year, (b) 2-year, (c) 10-year, and (d) 50-year return period pluvial floods.
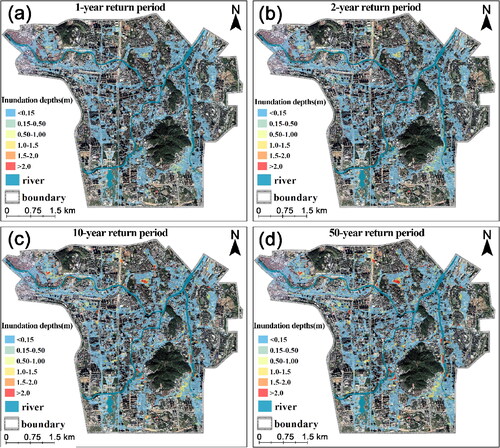
Figure 5. Maximum inundation extents and depths in the cases of (a) 20-year, (b) 50-year, (c) 100-year, and (d) 200-year return period fluvial floods.
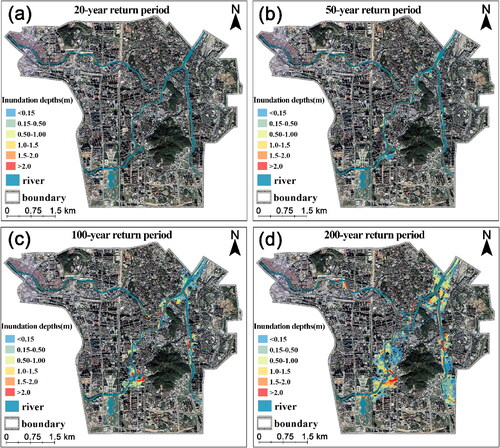
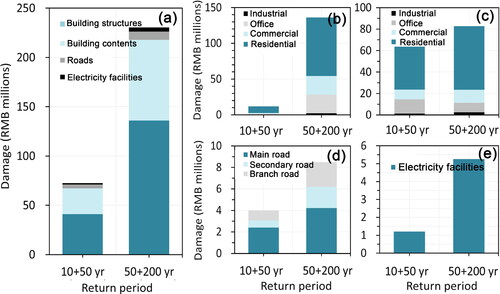
Figure 6. Maximum inundation extents and depths of compound floods: (a) combined 10-year pluvial and 50-year fluvial floods; (b) combined 50-year pluvial and 200-year fluvial floods.
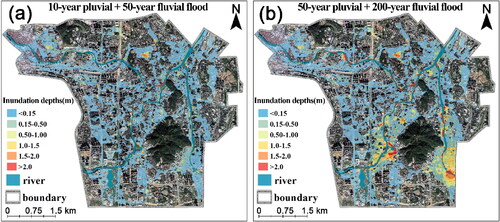
Figure 7. Direct economic losses of pluvial floods on urban physical systems: (a) total economic losses, (b) building structures, (c) building contents, (d) roads, and (e) electrical facilities.
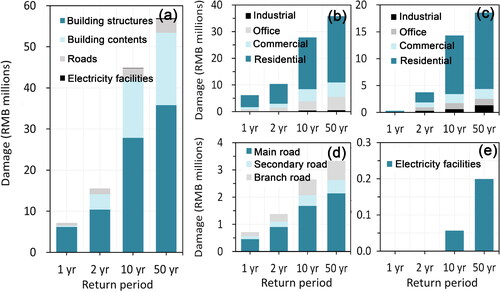
Figure 8. Direct economic losses on physical systems, from fluvial floods: (a) total direct economic loss, (b) building structures, (c) building contents, (d) roads, (e) electrical facilities.
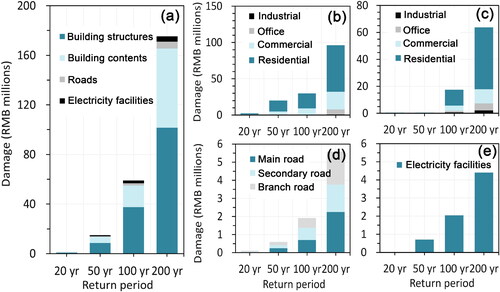
Figure 9. Direct economic losses to physical systems, from compound floods: (a) total direct economic losses, (b) building structures, (c) building contents, (d) roads, and (e) electrical facilities.