
Figures & data
Figure 1. The study area considered in this research.
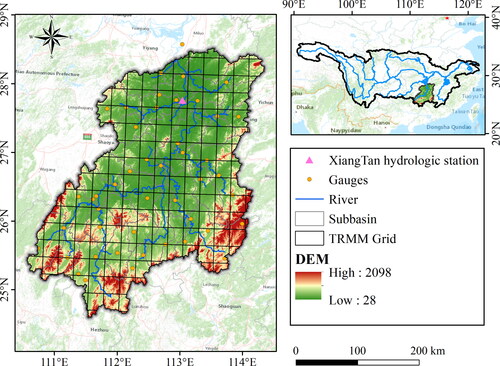
Table 1. Basic information of the research data.
Figure 2. Schematic of HEC-HMS modelling strategy.
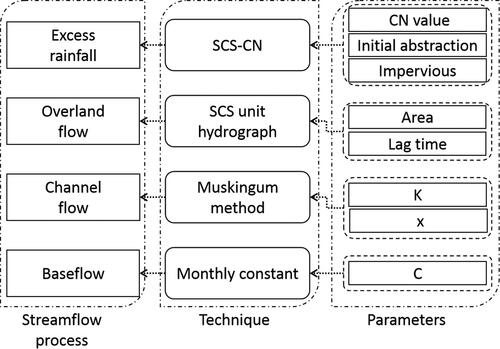
Table 2. The performance of the TRMM precipitation data at the 3-h, daily and monthly scales with the ground benchmark data.
Figure 3. Scatterplots of TRMM precipitation data against the ground benchmark data at the 3-h, daily and monthly scales.
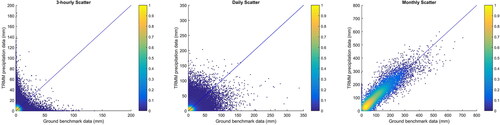
Table 3. The satellite rainfall detection capability performance results.
Figure 4. Scatterplots of TRMM precipitation data and ground benchmark data before (a) and after (b) the merging process at the 3-h.
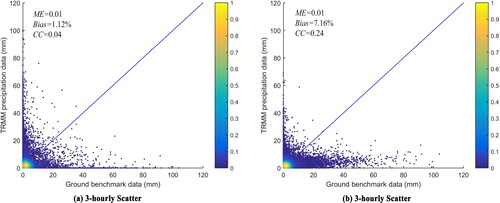
Table 4. The rainfall event detection capability performance of the datasets before and after the merging process.
Figure 5. The rainfall event accumulation volume of the ground-based rainfall observations before and after the merging process with satellite-derived precipitation estimates during the 9 selected flood events.
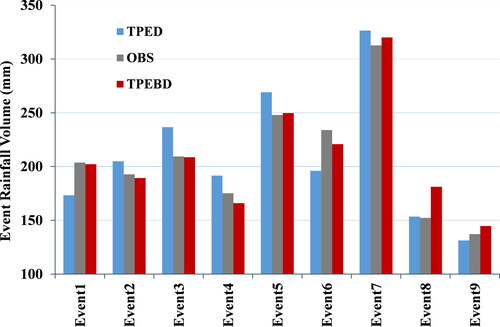
Figure 6. Comparisons of ground-observed streamflow hydrographs of the nine selected flood events and simulated runoff hydrographs forced by the TRMM precipitation data before and after the merging process.
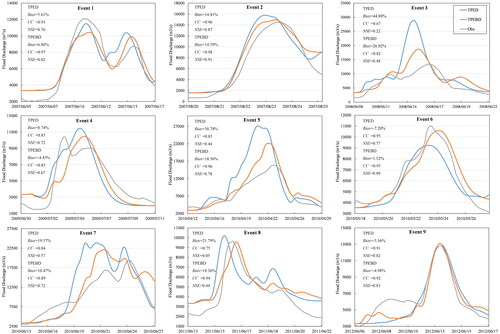
Figure 7. Boxplots of statistical indices (Bias, CC, and NSE) derived to compare the TPED- and TPEBD-forced flood discharge simulations. The five lines from the bottom to the top of each box represent five statistics in the data: the minimum value, first quartile, median, third quartile, and maximum value.
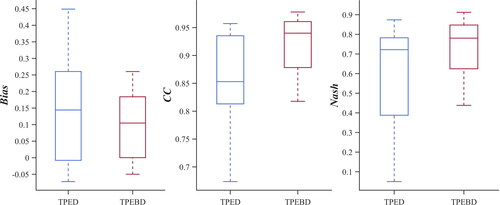
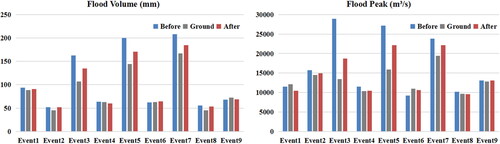
Figure 8. Comparison of for the characteristics of the simulated flood hydrographs forced by the TRMM precipitation data before and after the merging process.
Data availability statement
TRMM precipitation data are collected from Goddard Earth Sciences Data and Information Services Center (GES DISC), https://disc.gsfc.nasa.gov/datasets/TRMM_3B42_7/summary, where you can find several options for downloads. DEM data is provided by Geospatial Data Cloud site, Computer Network Information Center, Chinese Academy of Sciences. (http://www.gscloud.cn). Land use and land cover(LULC) data is derived from Institute of Geographic Sciences and Natural Resources Research, Chinese Academy of Sciences. Soil data is provided by National Tibetan Plateau Data Center (http://data.tpdc.ac.cn). Rain gauge observations are collected from National Meteorological Information Centre(http://data.cma.cn/). Hydrological station records are collected from Hunan Bureau of Hydrological and Water Resources. Derived data supporting the findings of this study are available from the corresponding author [J.D] on request.