
Figures & data
Figure 1. Model overview: (a) schematic diagram, (b) front view, and (c) side view.
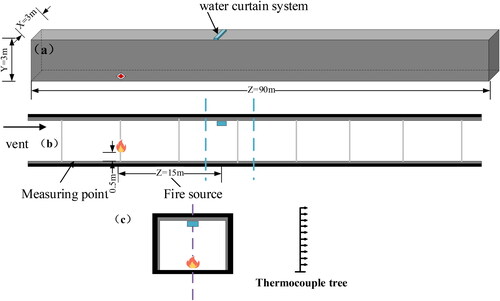
Table 1. Simulation parameter settings.
Figure 2. Network sensitivity analysis.
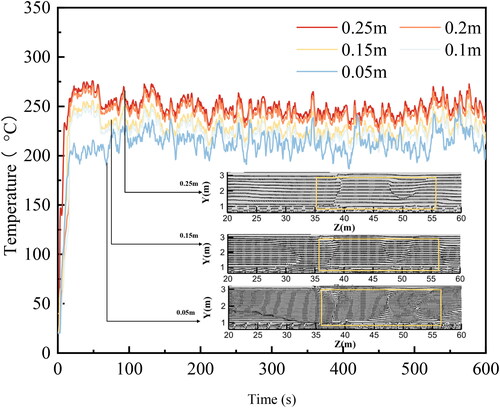
Figure 3. The number of particles ejected per second by the nozzle in the FDS.
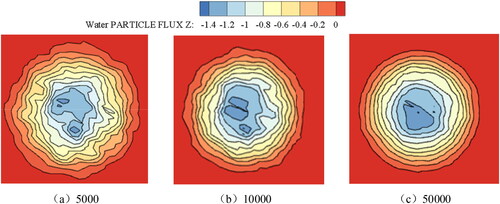
Figure 4. Schematic diagram of the bucket experimental setup: (a) side view; (b) top view.
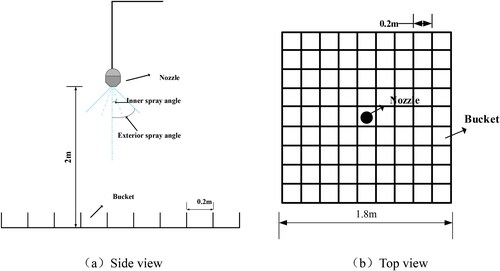
Figure 5. Average distribution of spray intensity of a single nozzle on the tunnel floor measured in three experiments.
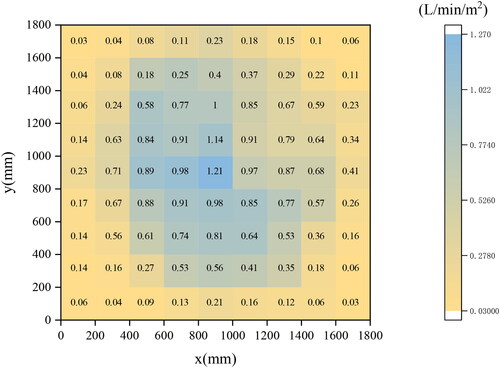
Figure 6. Four nozzle inner angles in the FDS.
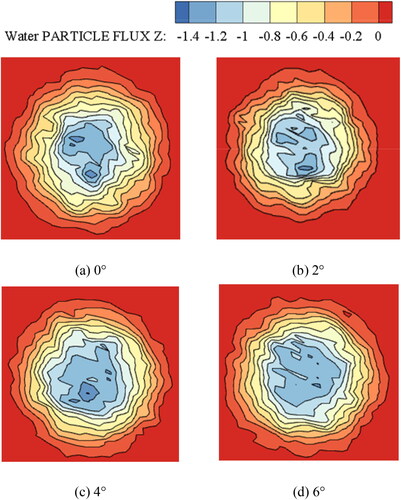
Figure 7. The belt fire results observed by Yuan et al. (2015) vs. the results reproduced by FDS.
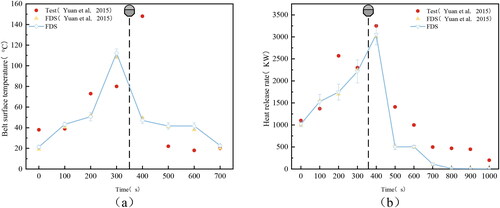
Figure 8. Variation curve of temperature in tunnel under different conditions 20 m below the fire source.
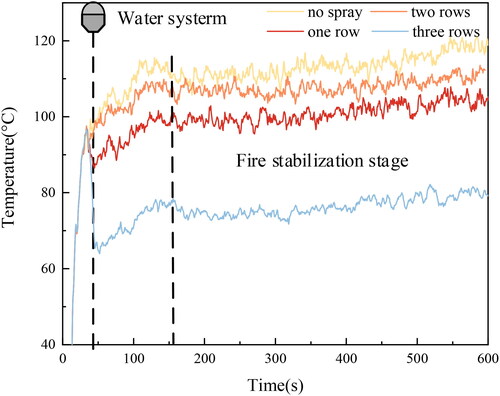
Figure 9. Variation of temperature in tunnel at 300s.
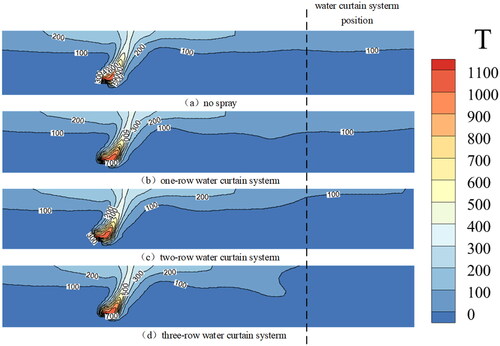
Figure 10. Temperature field (top) for 300 s (X = 1.5 m), vertical velocity component (middle) and longitudinal velocity component (bottom).
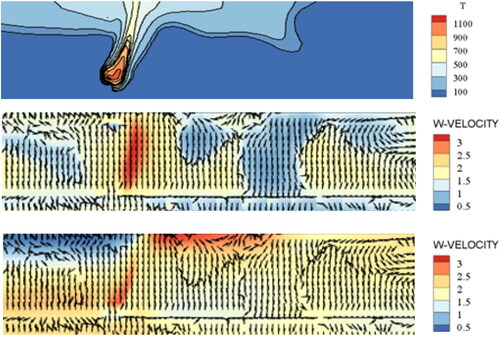
Figure 11. 300 s (Y = 1.5 m) vertical velocity component (top) and longitudinal velocity.
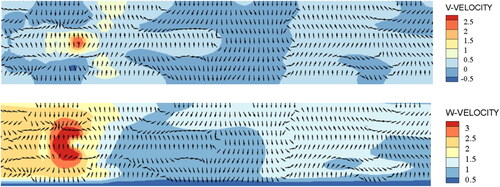
Figure 12. Temperature distribution in the vertical midplane.
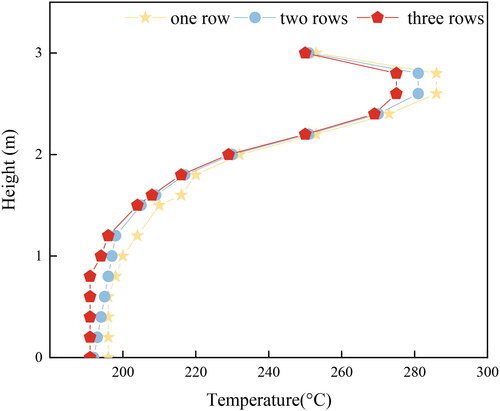
Figure 13. Upstream of the fire source Z = 5 m, between the fire source and water mist Z = 30 m, downstream of fire source Z = 70 m for no spray (left) and three-row water curtain system (right).
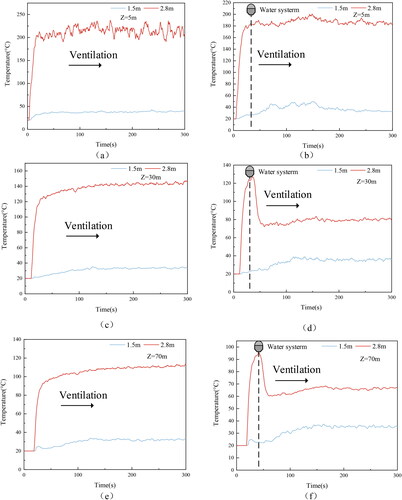
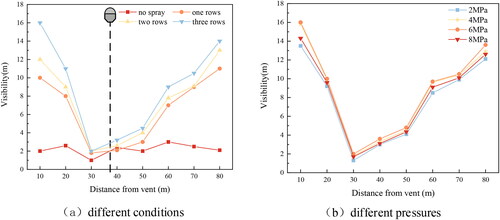
Figure 14. Numerical visibility distributions.
Data availability statement
The datasets generated and analyzed during the current study are available from the corresponding author on reasonable request.