
Figures & data
Figure 1. Regional geologic tectonics, major active faults configuration and strong earthquakes distribution, in which, BHB: BayanHar block; LMSF: Longmenshan fault; MJF: MinJiang fault; XSHF: XianShuiHe fault; LRBF: LongRiBa fault; ANHF: AnNingHe fault; HYF: HuYa fault; QCF: Qingchuan faultEKLF: Eastern KunLun fault; WQLF: Western qinling fault.
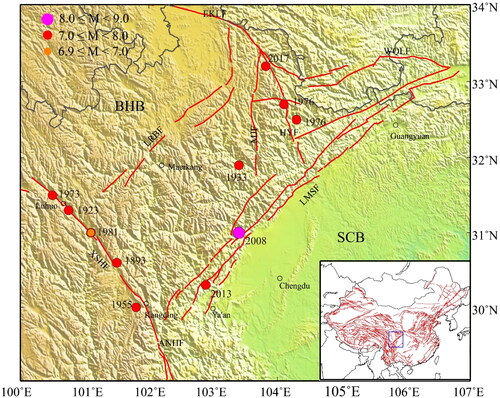
Figure 2. The constructed 3D Finite element model.
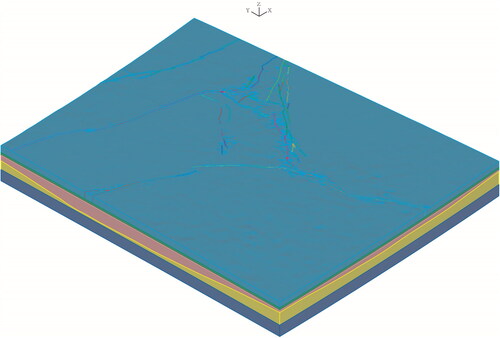
Figure 3. The elevation (a), Moho depth (b), Possion ratio at 0 and 20 km (c,d) and young’s modulus at 0 and 20 km (e,f) of model.
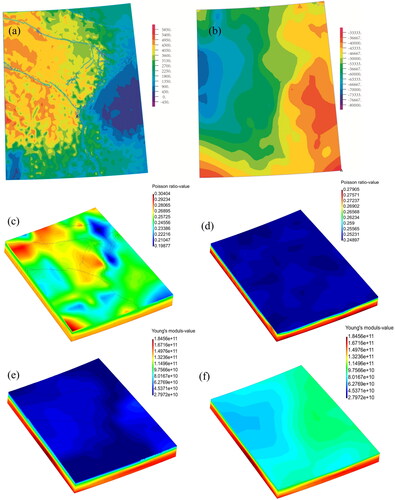
Table 1. Viscosity coefficient of this model.
Figure 4. (a) The comparison between the simulated result and observation of GPS, (b) The comparison between the simulation result and observation of the maximum principal compressive stress direction from World stress map 2008.
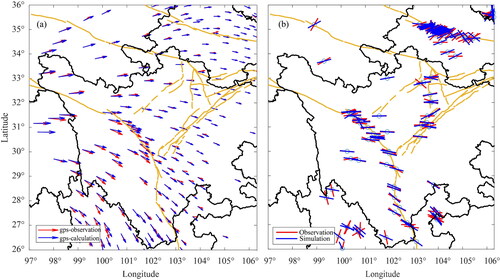
Table 2. The parameters of these strong earthquakes since 1893 in research region.
Figure 5. The annual Coulomb stress change at 20 km depth.
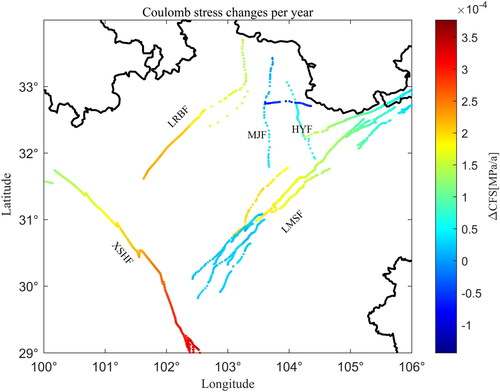
Figure 6. Coseismic Coulomb stress changes of strong earthquakes since 1893 in the research area.
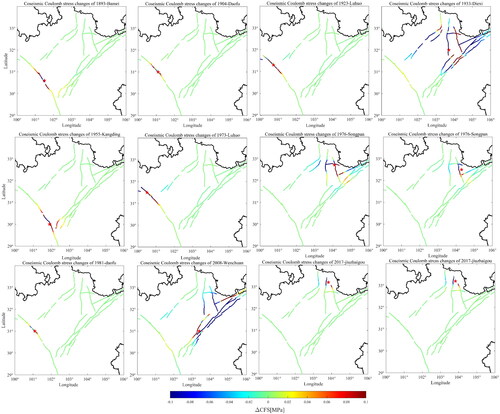
Figure 7. Stress evolution of the main faults in the study area since 1893.
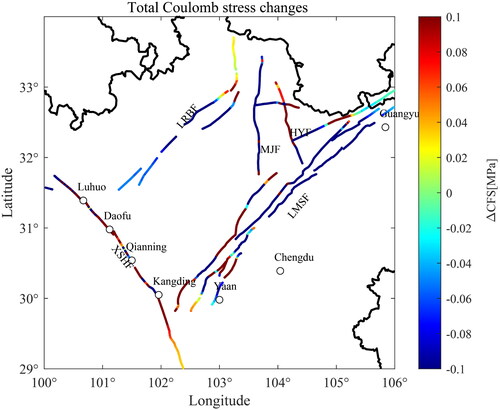
Figure 8. The spatial distribution of historical earthquake with magnitude over 3 (a) and spatial distribution of probability of strong earthquakes with Magnitude 6 (b) in the next 10 years in the study region.
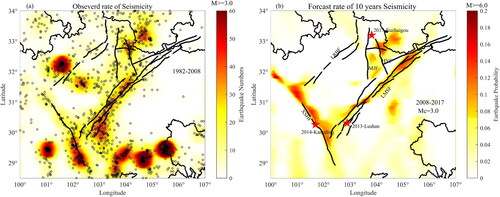
Table 3. Earthquake probability of major faults in study region after Wenchuan earthquake.
Figure 9. The spatial distribution of probability of strong earthquakes with Magnitude 6(a) and magnitude 7 (b) in the next 30 years in the study region.
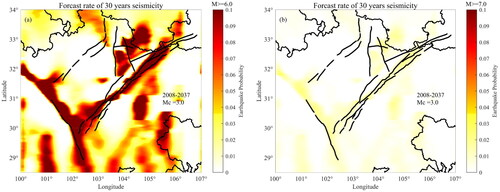
Figure 10. The spatial distribution of probability of strong earthquakes with Magnitude 6 in the study region in the next 10 years.
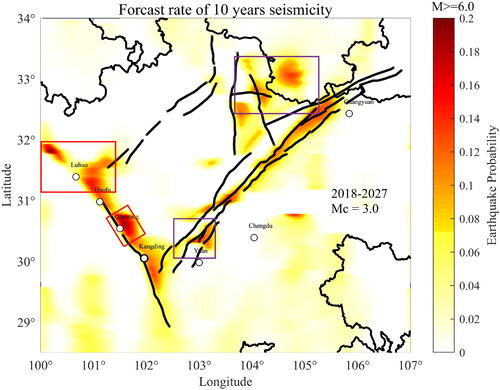
Table 4. Earthquake probability of major faults in study region after Jiuzhaigou earthquake.
Figure 11. The spatial distribution of probability of strong earthquakes and two strong earthquakes with Magnitude over 6 in the study region in 2022.

Code availability
The code is available from the corresponding author on reasonable request.
Data availability
The terrain elevation data of ETOPO1, which are released by the U.S. National Geophysical Data Center (http://www.ngdc.noaa.gov/mgg/global/global.html). The observed and inversed stress data which have been used to compare with our simulated stress are obtained from World Stress Map (http://www.world-stress-map.org/data/). The GPS data, Moho Depth, Poisson ratio data are obtained from authors of references which have described detailly in the manuscript. The datasets generated during and/or analyzed in this study are available from the corresponding author on reasonable request.