
Figures & data
Figure 1. The overview of the Fushun West Open-pit Mine.
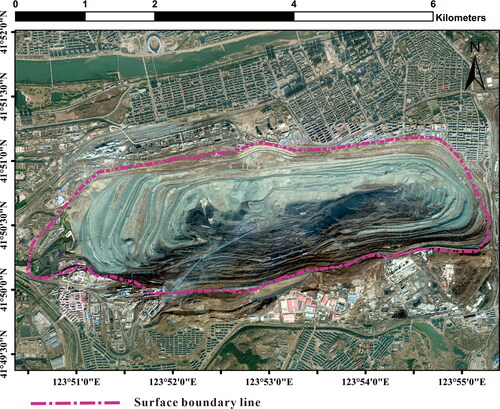
Figure 2. Engineering geological map of the Fushun West Open-pit Mine.
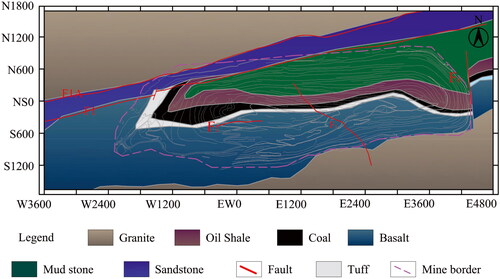
Figure 3. Identification of unloading zones and subsurface structures by GPR.
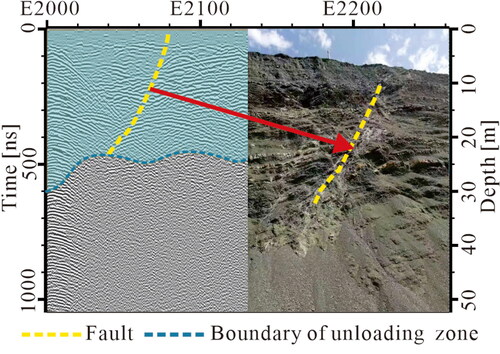
Figure 4. Identification of unloading zones by RQD value and water injection Test.
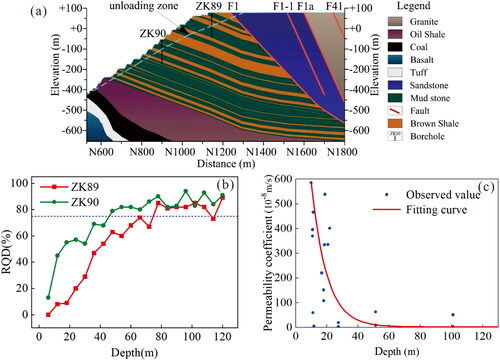
Figure 5. Fine geological modeling. (a) UAV tilt photography. (b) DTM model. (c) Reference control profiles (spacing 50 m). (d) Overview of the geological model.
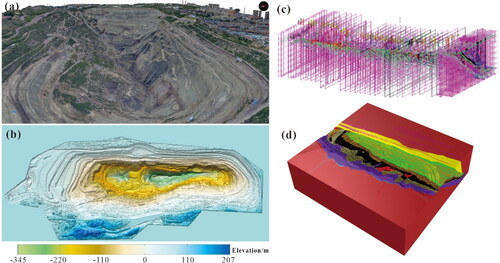
Figure 6. High precision tetrahedral mesh of the Fushun West Open-pit Mine. (a)Overview of the mesh model. (b) Details of the refined mesh.
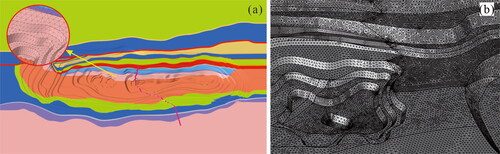
Table 1. Physical and mechanical parameters used in this study.
Figure 7. Simulation results of excavation. (a)Y-directional displacement. (b) Changes in von Mises stress caused by excavation.
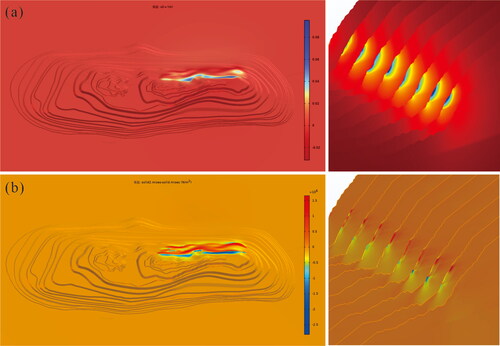
Figure 8. The evolution and spatial distribution of damaged elements at different SRF.
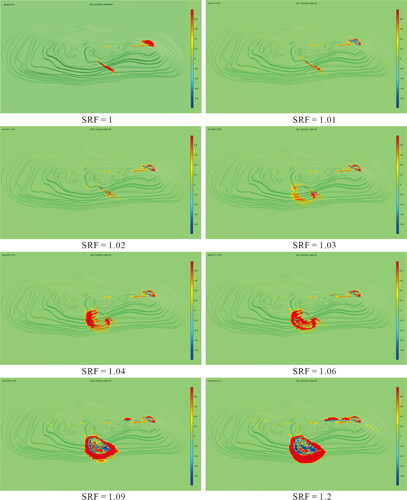
Figure 9. UAV tilt photography of landslides in the north slope of the Fushun West Open-pit Mine in Recent years.
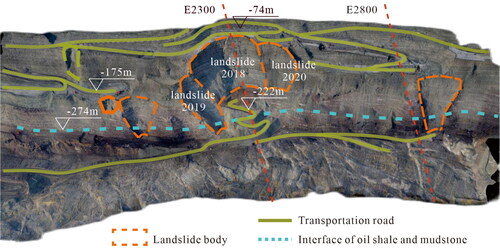
Figure 10. Annual vertical deformation rate of 2019. (a) Overall view. (b) East side of the north slope. (c) South slope.
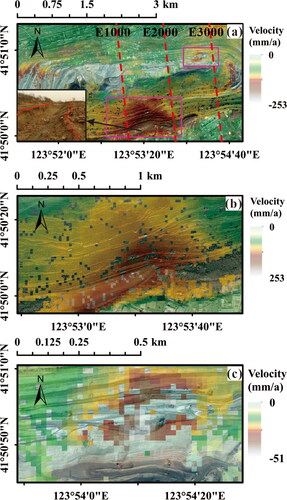
Figure 11. Overview of the backfilling scheme.
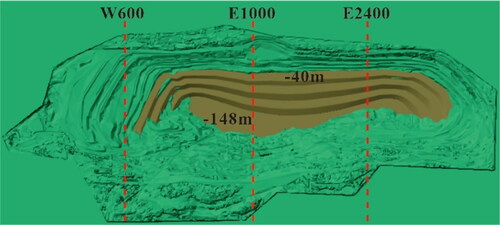
Figure 12. Backfilling scheme (profile of E1600).
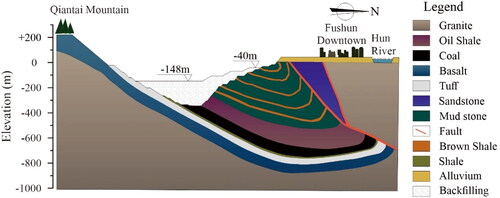
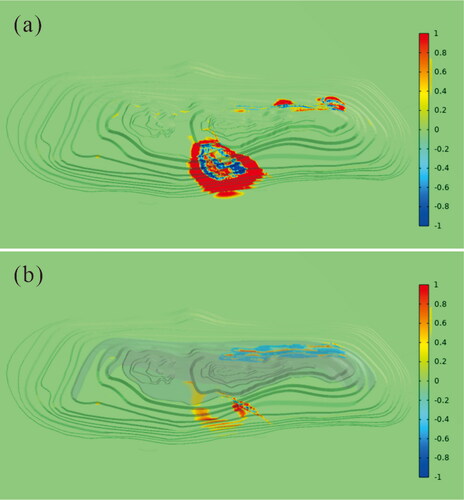
Figure 13. Comparison of the distribution of damaged elements before and after treatment when SRF = 1.1. (a) Current state slope. (b) Slope after backfill treatment.
Data availability statement
The data that support the findings of this study are available from the corresponding authors, upon reasonable request.