Figures & data
Figure 1. The JDL Data fusion process model, after Hall and Llinas (Citation1997).
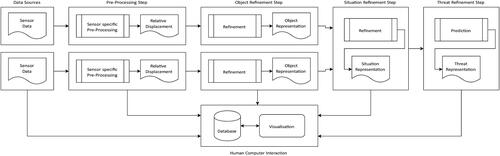
Figure 2. The proposed Multimodal Asynchronous Kalman Filter architecture.
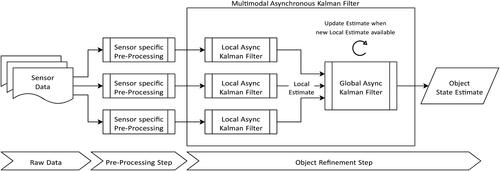
Figure 3. (a) Hillshaded elevation model of the unstable rock slope Stampa showing the locations of sensors. Coodinates given in UTM zone 32V. (b) Block 4a and its highly fractured base outlined. Prism locations are shown.
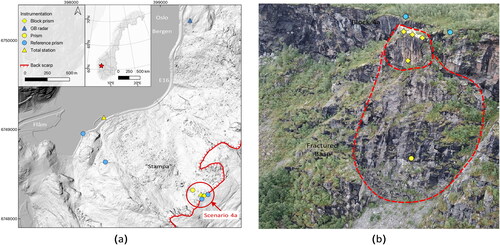
Table 1. Instruments in the sensor network.
Figure 4. Instruments on Block 4a.
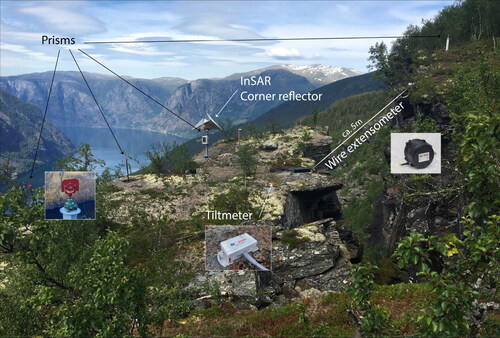
Figure 5. Aggregated total station data revealing displacement along east, north and Height after pre-processing.
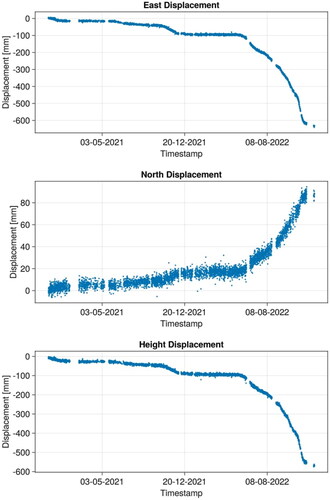
Figure 6. (a) Satellite orbit direction and heading angle α in 2D. (b) LOS to E-W and up decomposition, incidence angle θ. Figures after Cigna et al. (Citation2021).
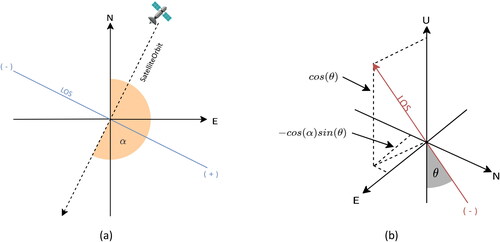
Figure 7. East and height displacement derived from satellite InSAR after Pre-Processing.
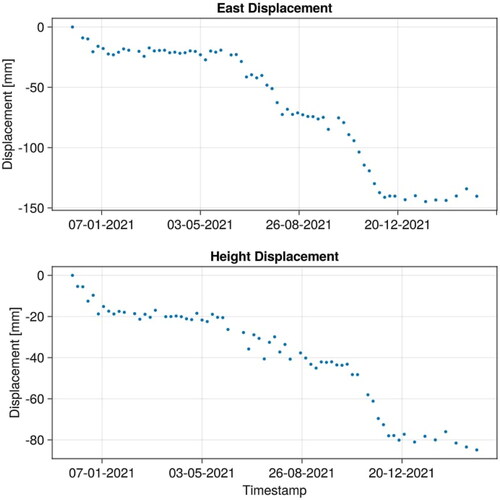
Figure 8. North and height displacement derived from ground-based InSAR after Pre-Processing.
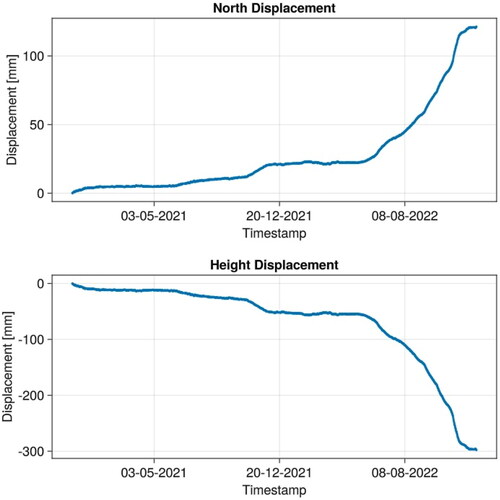
Figure 9. East and height displacement derived from extensometer after Pre-Processing.
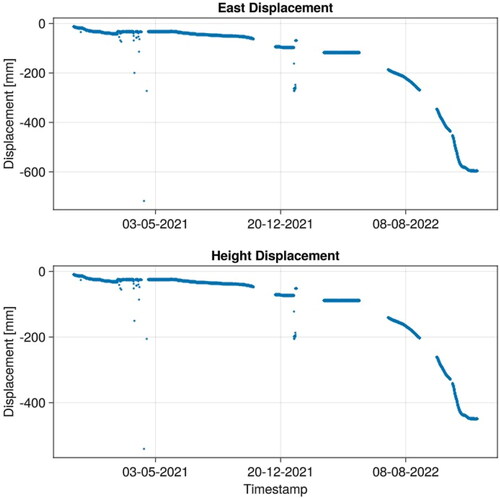
Figure 10. Rotation around east and north axes derived from tiltmeter after Pre-Processing.
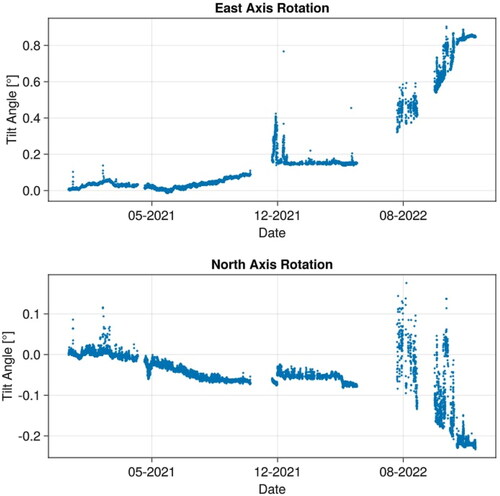
Table 2. Relation pre-processed measurements to system states.
Figure 11. Fusion result constraining estimated Block 4a (a) displacement (b) velocity, and (c) roto-translation in 3D using the Multimodal Asynchronous Kalman Filter. Red wireframes in (c) indicate the dates on the ticks of the colorbar.
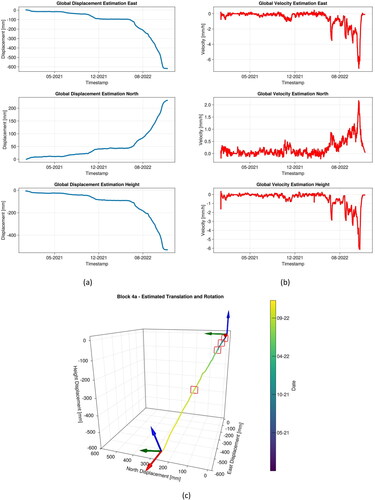
Figure 12. (a) Multimodal Asynchronous Kalman Filter fusion result showing estimated (a) displacement and (b) velocity of the base of Block 4a.
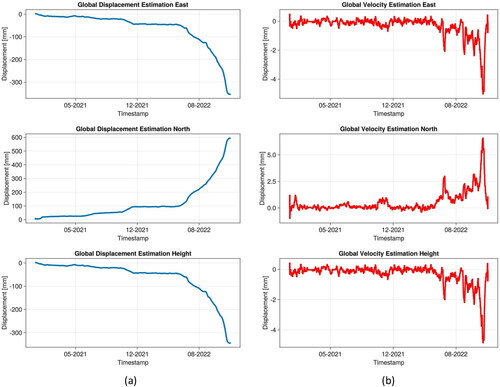
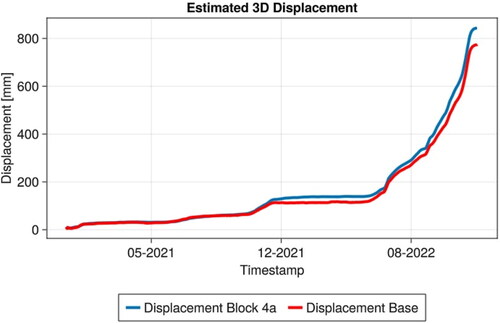
Figure 13. Comparison of estimated 3D displacement for Block 4a and its base.