
Figures & data
Figure 1. Geographical location, elevation (color shaded area) and 6 climatic zones of Chongqing, D and W representing Daba Mountain and Wuling Mountain respectively.
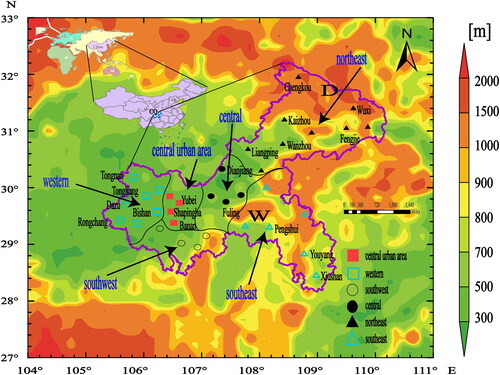
Figure 2. Overall flowchart of the manuscript.
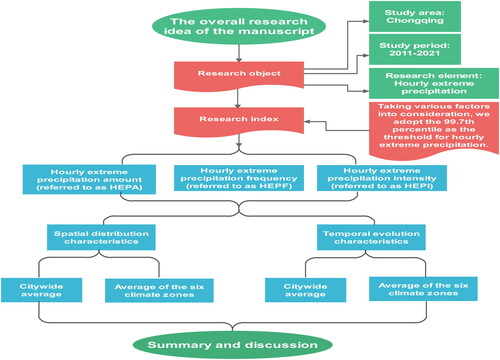
Table 1. The threshold of hourly extreme precipitation in different percentile in Chongqing
Figure 3. Spatial distribution of hourly extreme precipitation thresholds at the 99.7th percentile in Chongqing.
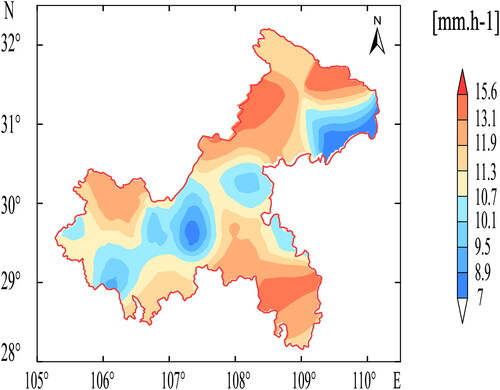
Figure 4. Contribution ratio of hourly extreme precipitation amount to total precipitation amount of summer in Chongqing from 2011 to 2021.
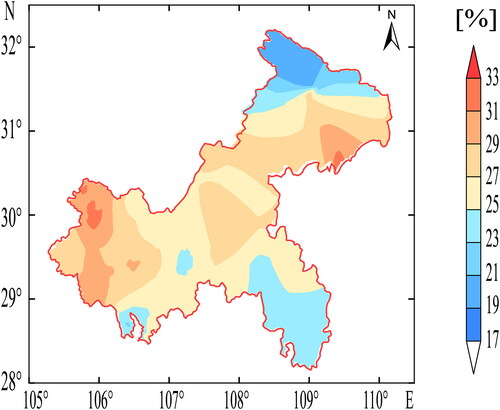
Figure 5. Spatial distribution of HEPA, HEPF and HEPI in Chongqing
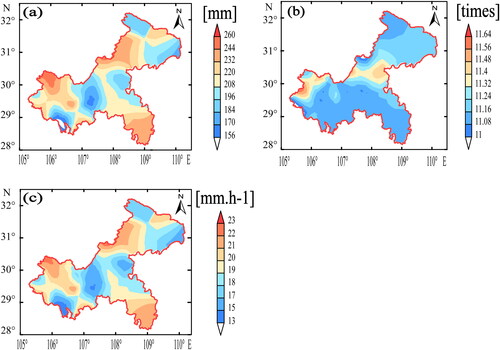
Figure 6. Spatial distribution of HEPA, HEPF and HEPI from May to September in Chongqing during 2011-2021.
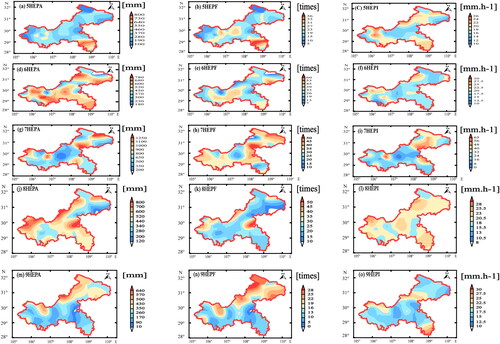
Figure 7. Interannual variation characteristics (a), intermonthly variation characteristics (b), diurnal variation characteristics (c) of HEPA, HEPF and HEPI in Chongqing.
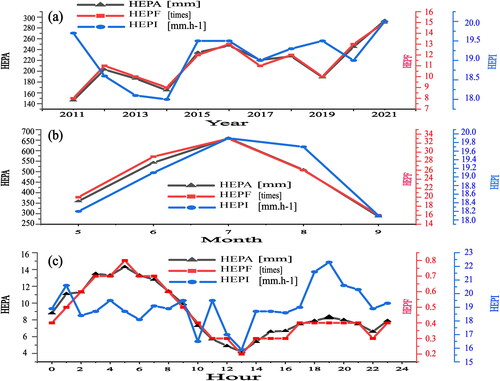
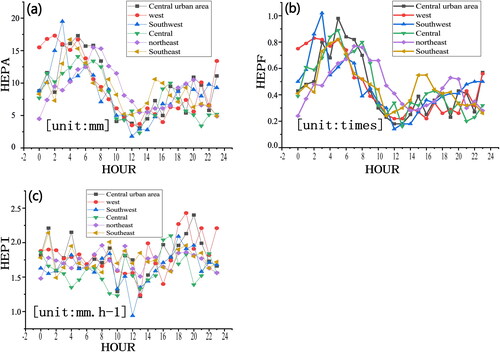
Figure 8. Hourly variation of multi-year average HEPA, HEPF and HEPI in six sub-regions of Chongqing from 2011 to 2021.
Data availability statement
All data used during the study were provided by the China Meteorological Administration(http://data.cma.cn/). Direct requests for these materials may be made to the provider.