
Figures & data
Figure 1. The study area location map is shown in four sections. The study area is depicted in Section (A) over the administrative boundaries of the Himachal Pradesh Mandi district. The radiometrically and atmospherically corrected False colour composite (FCC) Landsat 8 datasets of Joginder Nagar, thrust, GSI landslide points, and National highway were utilized to represent the study region landscape, as mentioned in Section (B). Section (C) depicts the geology draped over hillshade map, as well as thrust, GSI landslide locations, and stream data for the research area. Section (D) depicts the research area’s surface features in FCC imagery, landslide incidents, and National highway.
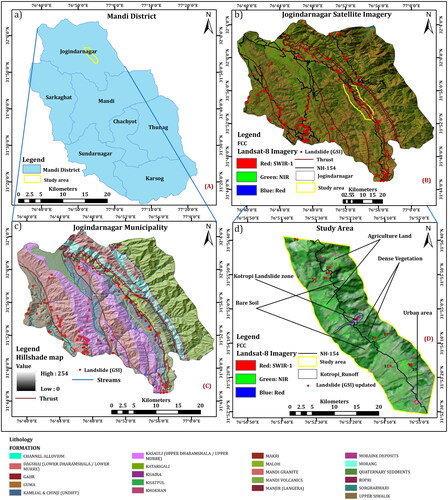
Figure 2. Field photos taken around Joginder Nagar Municipality of Mandi district along the National Highway (NH-154) near to the Kotrupi landslide area.
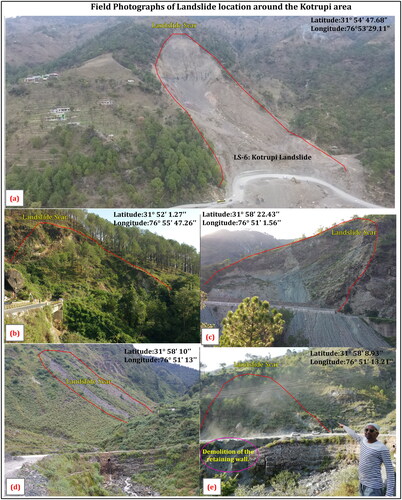
Table 1. Updated GSI landslide points updated from Google Earth and field visits.
Figure 3. The variation of normal baseline and coherence with respect to various dates (temporal baseline) for the short temporal baseline graph (STBG) method where 117 SAR pairs are used in this work.
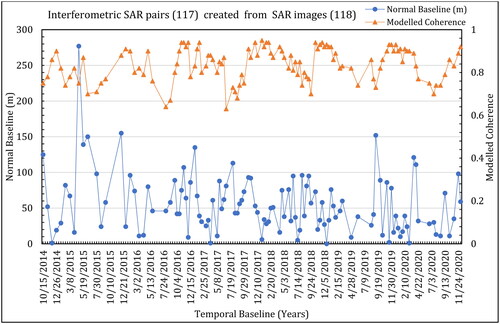
Figure 4. The research procedure includes evaluating 118 Sentinel-1 SLC images and determining multi-temporal coherence and landslide deformation values inside the Kotrupi landslide run-off area shown in Flowchart 1. The flowchart also shows how to calculate NDVI and vegetation masking using deformation maps, as well as how to verify the deformation results with time series Planet satellite images.
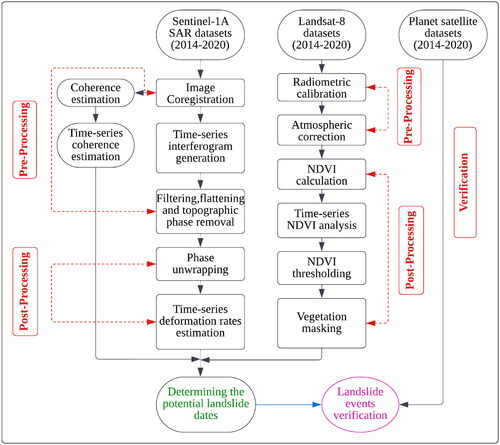
Figure 5. The time-series landslide deformation analysis of six updated landslide GSI points is shown in .
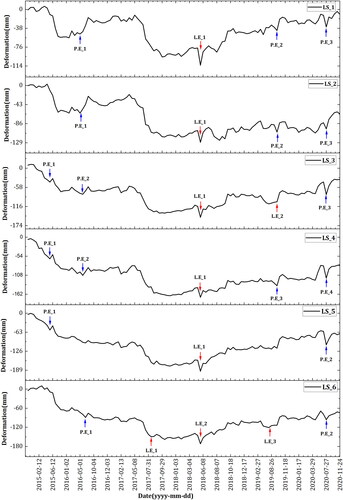
Figure 6. The multi-temporal landslide deformation analysis of five updated landslide GSI points is shown in .
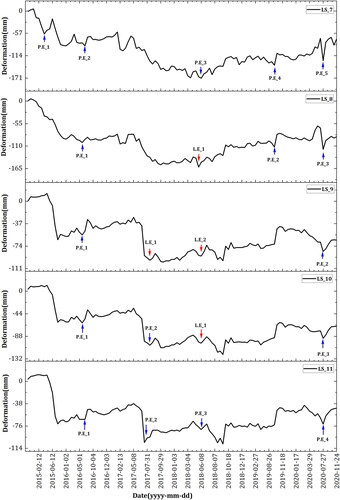
Figure 7. The average time series analysis between landslide and non-landslide points is depicted in the diagram.
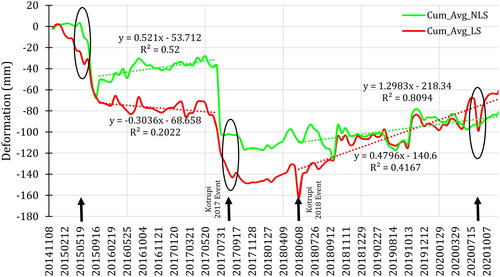
Table 2. Temporal baseline, perpendicular baseline modelled coherence and also cloud cover percentage taken from MODIS for those times when a sudden dip appears in non-landslide points.
Figure 8. The use of multi-temporal planet surface reflectance satellite imagery to verify updated GSI landslide points.
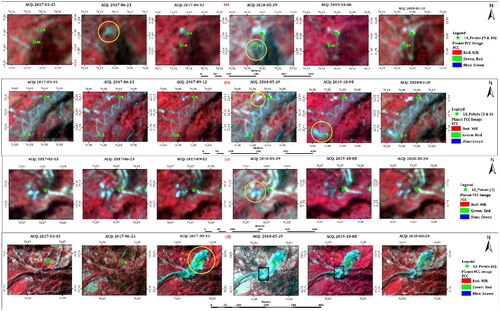
Figure 9. A multi-temporal landslide deformation map after vegetation masking. The deformation map (REF: 31 July 2017, SEC: 12 August 2017) before the Kotrupi landslide is presented in section (a). The deformation map (REF: 12 August 2017, SEC: 24 August 2017) following the Kotrupi landslide is displayed in Section (B). Similarly, the deformation map (REF: 03 May 2018, SEC: 27 May 2018) after a road expansion is presented in Section (C). The landslide deformation map between (REF: 09 March 2020, SEC: 10 April 2020) is shown in Section (D).
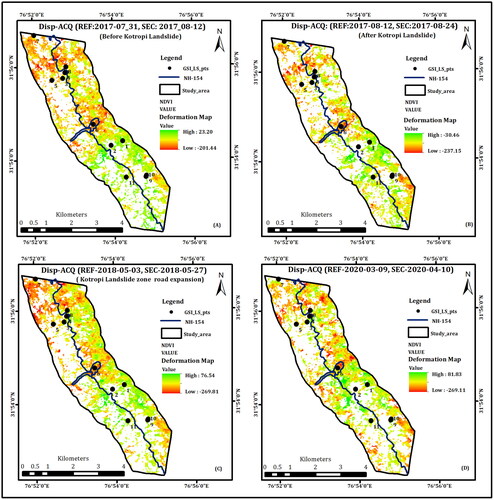
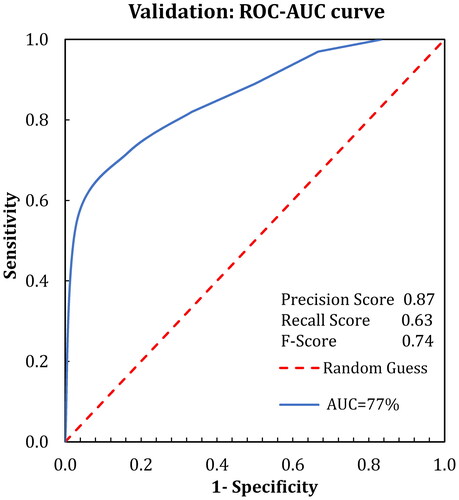
Figure 10. The ROC-AUC curve on 0.77 obtained in this study along with the precision, recall and F score values estimated on the averaged normalized landslide deformation map.
Supplemental Material
Download Zip (45.2 KB)Data availability statement
The data used in this work is freely available and anyone can use it by downloading it from sources. Further data may be shared upon reasonable request.