
Figures & data
Table 1. Accident cases of foundation pit collapse from 2020 to 2021.
Figure 1. Keyword co-occurrence knowledge graph: (a) multi-criteria decision-making (MCDM) method correlation diagram; (b) MCDM research heat map for 2019–2021.
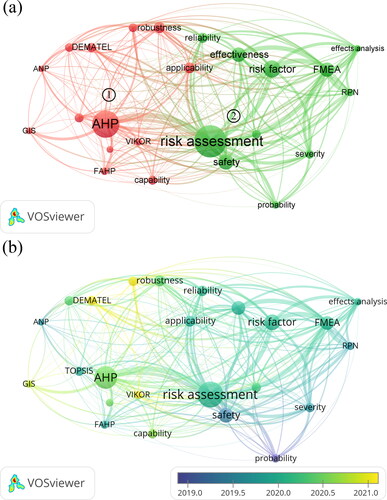
Figure 2. Excavation risk assessment and management framework.
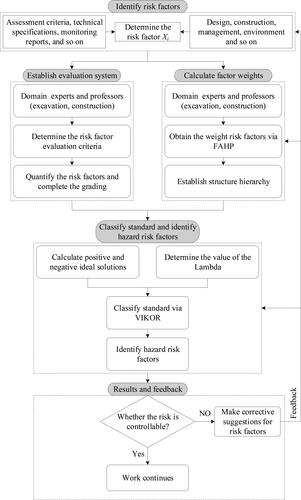
Table 2. Risk level implication.
Table 3. Reciprocal of triangular fuzzy numbers and their meanings (Adapted from Lyu et al. Citation2019).
Figure 3. Triangular membership function (F1 > F2). (Adapted from Lyu et al. Citation2019).
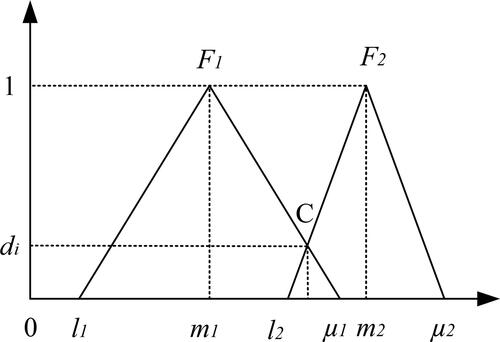
Table 4. The values of RI for judgment matrices of order 1 to 9.
Figure 4. Geographical location of the foundation pit.
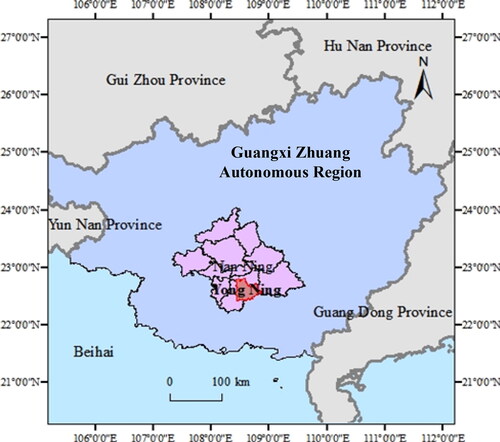
Figure 5. Accident location: (a) foundation pit plan; (b) foundation pit details (adapted from Baidu map).
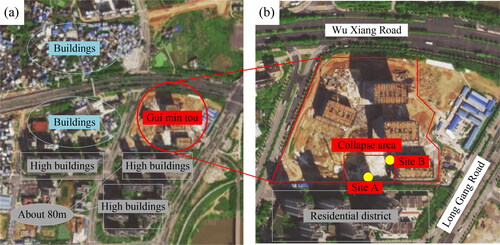
Figure 6. Collapse accident in the Guimintou foundation pit: (a) retaining structure failure; (b) parking shed on the slope (Chutian City Daily (CCD), Citation2022).
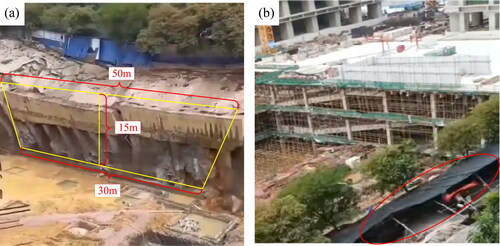
Figure 7. Meteorological data of Nanning in May (Tian Qi Website (TQW) Citation2022).
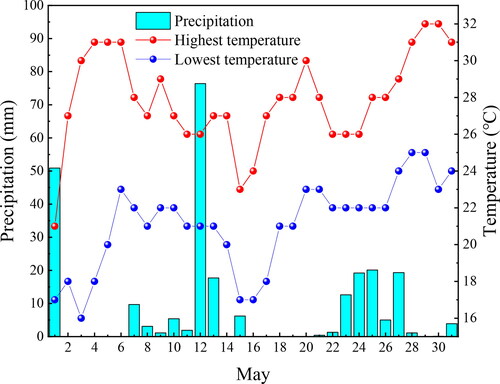
Table 5. Interval division of influential factors.
Figure 8. Hierarchy chart of the potential safety risks in the Guimintou foundation pit.
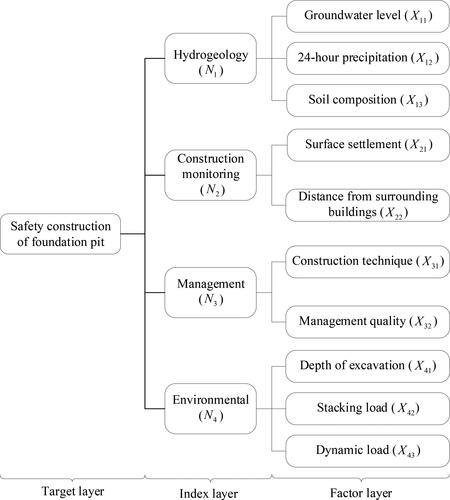
Figure 9. Weight chart of evaluation index and risk factors: (a) weight of evaluation index. (b) Weight of risk factors.
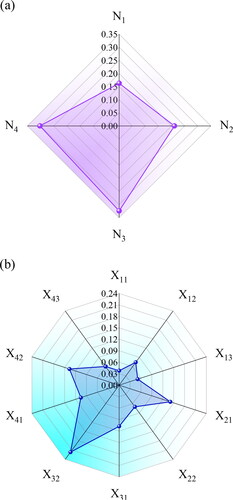
Table 6. Triangular fuzzy matrix.
Figure 10. Risk level chart.
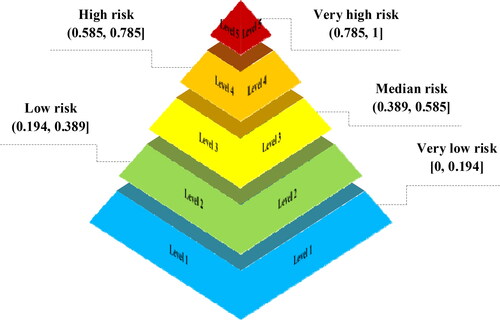
Table 7. Scoring table for risk factor of the excavation.
Table 8. Square normalization matrix.
Table 9. Boundary standards of risk factor grade.
Figure 11. Comparison of FAHP, AHP, and PC weight results.
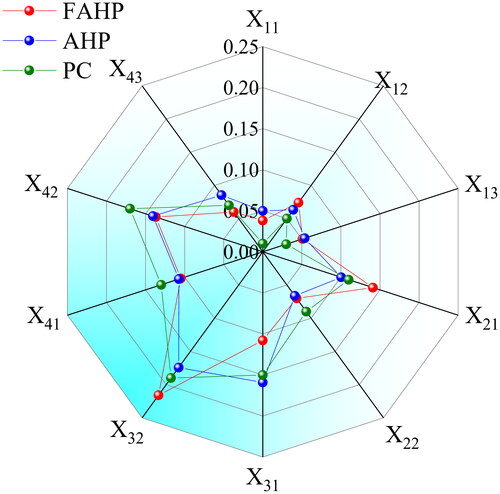
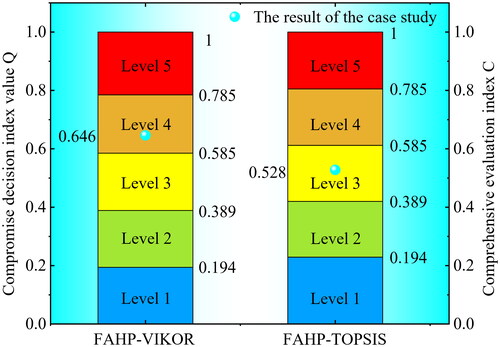
Figure 12. Comparison of calculation results between FAHP-VIKOR and FAHP-TOPSIS.
Data availability
Data will be made available on request.