
Figures & data
Figure 1. Tectonic setting in and around Türkiye. Green stars show the 2023 Mw 7.8 and 7.5 mainshocks occurring at the intersection of the East Anatolian Fault Zone (EAFZ) with the Dead Sea Fault Zone (DSF. cyan bold lines show active fault traces. Circles show epicentres of Ms ≥ 7.0 events from 1900 to 2022; these event data were acquired from the China Earthquake Network Center (CENC). The number beside each circle shows the year in which each earthquake occurred. The blue bold arrow shows the direction in which the Anatolian block moves. The black arrows beside the active fault traces show the directions in which the faults move. The capital letters beside the cyan lines show the names of the active faults. The region enclosed by the yellow box is considered in the present study. The beach ball shows the focal mechanism solution data that were acquired from the USGS earthquake catalogue [https://earthquake.usgs.gov/earthquakes/search/] (NP1: 318°, 89°, −179°; NP2: 228°, 89°, −1°).
![Figure 1. Tectonic setting in and around Türkiye. Green stars show the 2023 Mw 7.8 and 7.5 mainshocks occurring at the intersection of the East Anatolian Fault Zone (EAFZ) with the Dead Sea Fault Zone (DSF. cyan bold lines show active fault traces. Circles show epicentres of Ms ≥ 7.0 events from 1900 to 2022; these event data were acquired from the China Earthquake Network Center (CENC). The number beside each circle shows the year in which each earthquake occurred. The blue bold arrow shows the direction in which the Anatolian block moves. The black arrows beside the active fault traces show the directions in which the faults move. The capital letters beside the cyan lines show the names of the active faults. The region enclosed by the yellow box is considered in the present study. The beach ball shows the focal mechanism solution data that were acquired from the USGS earthquake catalogue [https://earthquake.usgs.gov/earthquakes/search/] (NP1: 318°, 89°, −179°; NP2: 228°, 89°, −1°).](/cms/asset/20f3af51-b540-433c-bf09-b9187a8cbc00/tgnh_a_2284118_f0001_c.jpg)
Figure 2. (a) The epicentres of aftershocks of the Mw 7.8 Kahramanmaras earthquake. Grey circles show the epicentres of earthquakes of M ≥ 4.0, from 6 to 8 February, 2023. (b) Epicentres of earthquakes (M ≥ 4.0) that occurred from January 2002 to January 2023. The cyan star represents the epicentre of the Mw 7.8 mainshock. The red lines show the active fault traces, and the blue boxed region shows the study region for calculation of the P-value as a function of time.
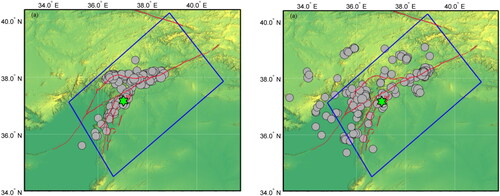
Figure 3. (a) Cumulative distribution of number of earthquakes versus magnitude. (b) Map showing the chronological orders of earthquakes of M ≥ 4.0 in the study region.
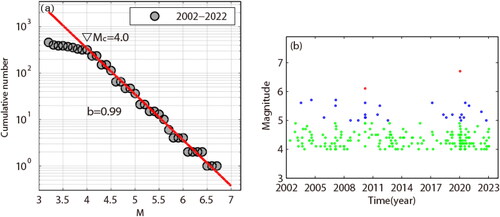
Figure 4. Temporal variations in the stresses caused by the earth tides on the focal fault plane of the Kahramanmaras earthquake at depth of 10 km. (a) The shear stress τ. (b) The normal stress σn. The date is given in the format year/month/day.
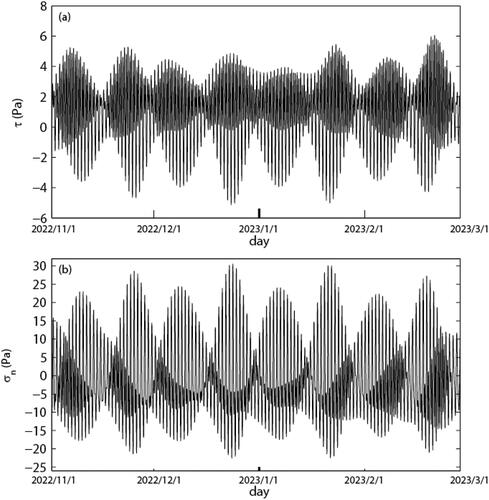
Figure 5. Temporal variations of the stresses caused by the earth tides with different cycles on the focal fault plane of the Kahramanmaras earthquake at depth of 10 km. The left column shows the shear stress τ and the right the normal stress σn. (a) and (b) diurnal and semi-diurnal tides, the date is given in the format year/month/day. (c) and (d) lunar and fortnightly tides, the date is given in the format year/month/day. (e) and (f) annual and semi-annual tides, the date is given in the format year. The downward arrow ‘↓’ shows the occurrence time for the Kahramanmaras earthquake.
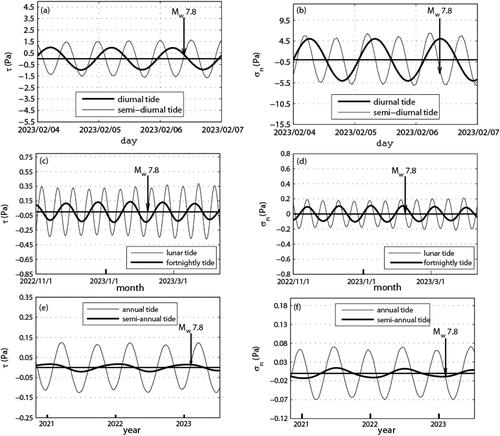
Table 1. The values of zα at different significance levels.
Figure 6. (a) p Value as a function of time (the downward arrow '↓' shows the occurrence time of the Mw 7.8 Kahramanmaras event). (b) Histogram showing the frequency of the phase angle of earthquakes occurring from February 2016 to January. 2023. Thick solid curve denotes sinusoidal function fitted to the frequency distribution. (c) and (d) Spatial distribution of p value within 9 years prior to the Mw 7.8 Kahramanmaras earthquake, the star shows its epicentre. Grey circles show the epicentres of aftershocks.
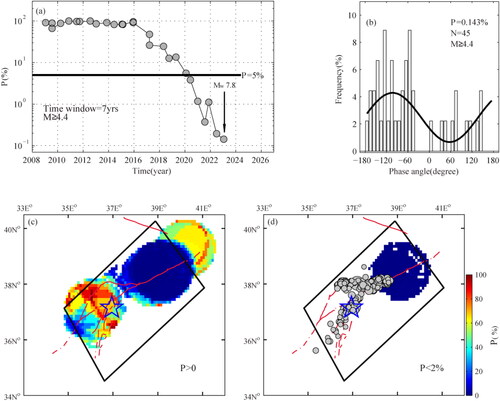
Figure 7. (a) Cumulative seismic strain release ∑ε versus time. The line with ; symbols is for PEQs, and the line with ☐ symbols is for NEQs. (b) Rp versus time, with a moving 9-year time window moved by 6 months. (c) The time rate k of CSSR versus time for both PEQs and NEQs. The orange circles show the time rate k for PEQs, and the cyan squares are for NEQs, with a moving 10-year time window moved by 6 months. (d) Rk as a function of time. The downward arrow shows the occurrence of the Kahramanmaras earthquake.
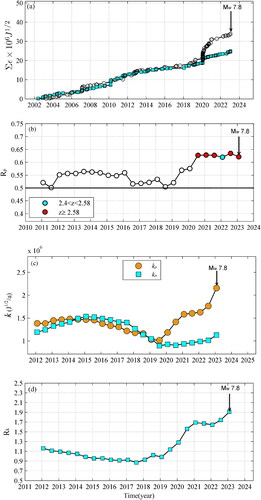
Figure 8. Schematic diagram of differential stress as a function of time (based on rock test results).
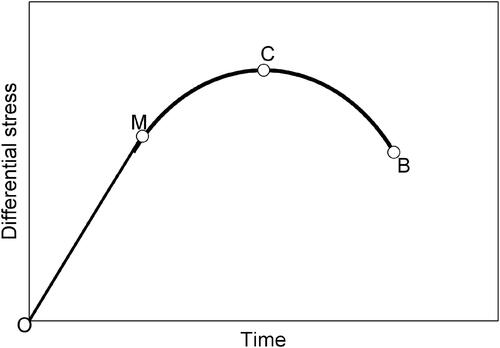
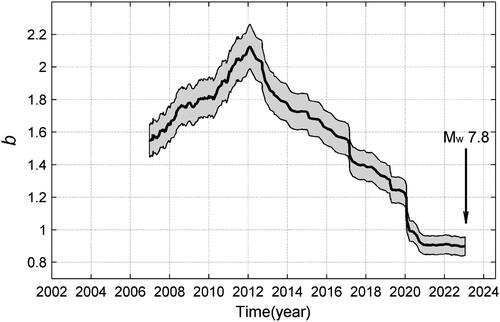
Figure 9. The curve of b-values over time for the study region the thick black line shows the b-values. The light grey area indicates the 95% confidence limit. The vertical arrow ‘↓’ indicates the Mw 7.8 Kahramanmaras mainshock.
Data availability statement
The data used to support the findings of this study are available from the corresponding author upon request.