
Figures & data
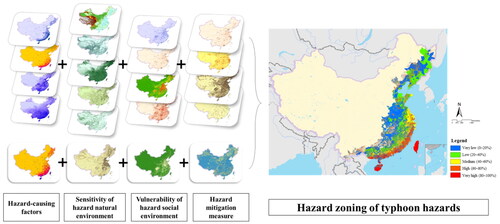
Figure 1. Typhoon mean intensity and paths based on historical data from 1949 to 2017: (a) the mean intensity distribution of typhoon monitoring points from 1949 to 2017; (b) the typhoon paths from 1949 to 2017.
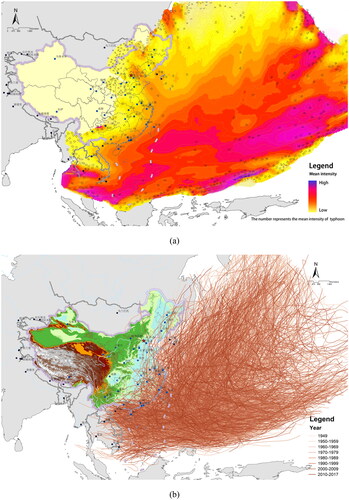
Figure 2. Typhoon disaster assessment model.
Notes: The addition and subtraction signs near the index represent the positive and negative correlation indexes, respectively.
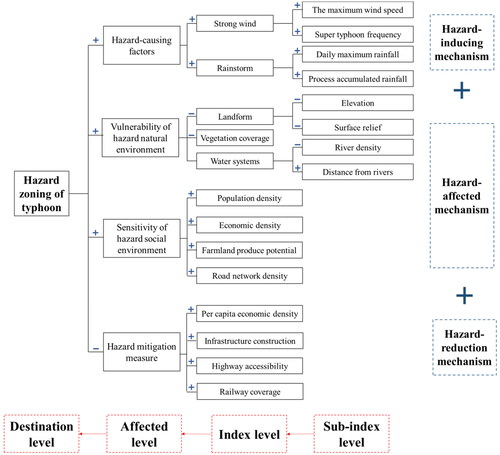
Table 1. The indicators in the typhoon hazard assessment model.
Table 2. Statistics of questionnaire results and index weights.
Figure 3. Zoning based on hazard-causing factors in China: (a) the maximum wind speed of landing typhoons from 1949 to 2017 (m/s); (b) the frequency of super typhoons per year from 1949 to 2017; (c) the proportion of the maximum rainstorm in the total rainfall in each city from 1961 to 2015 (%); (d) Process accumulated rainfall during landing typhoons from 1961 to 2017 (mm); (e) the overlaid layer of four hazard-causing factors (standardized value).
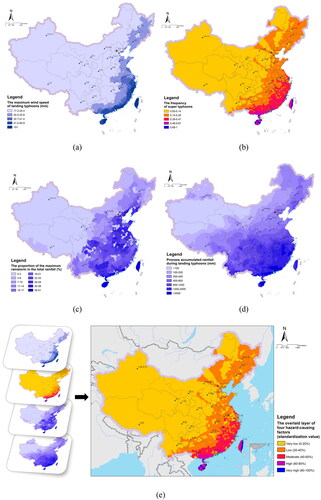
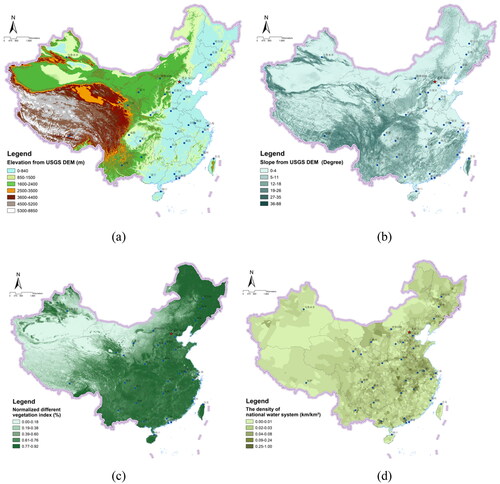
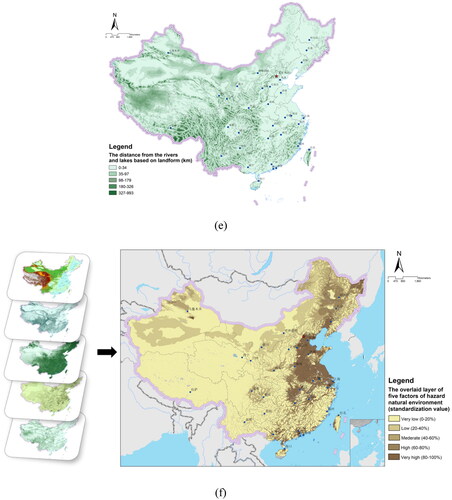
Figure 5. Zoning based on the vulnerability of hazardous social environment in China: (a) population density per square kilometer in 2015 (number of people per square kilometer); (b) economic density per square kilometer in 2015 (GDP per square kilometer); (c) Farmland produce potential from global agro-ecological zones in 2015 (kg/ha); (d) road network density of each county from Google map in 2018 (km/km2); (e) the overlaid layer of four factors of hazard social environment (standardized value).
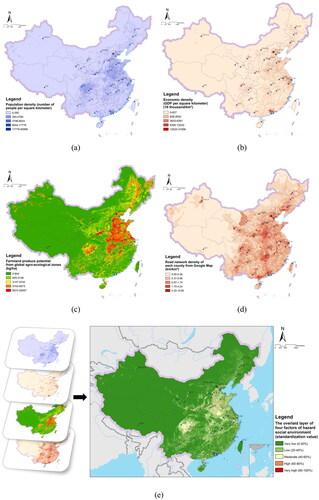
Figure 6. Regionalization based on hazard mitigation measures in China: (a) per capita GDP per square kilometer in 2015 (yuan per number of people and square kilometer); (b) infrastructure density (the number of hospitals) of each county from Google Maps in 2018 (the number per square kilometer); (c) highway accessibility in 2018 (h); (d) railway network density of each county from Google Maps in 2018 (km/km2); (e) the overlaid layer of four factors of hazard mitigation measures (standardized value).
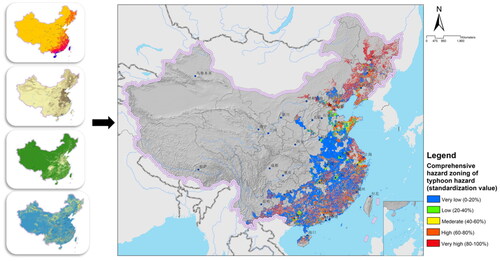
Figure 7. Comprehensive hazard zoning of typhoon hazards in China.
Supplemental Material
Download MS Word (37.9 KB)Data availability statement
All datasets used in this study are open-source and freely available from the sources cited in the text.