
Figures & data
Figure 1. Information of study area.
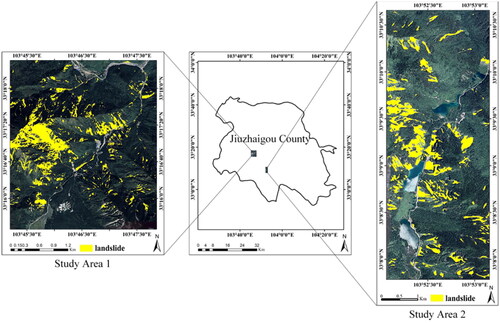
Figure 2. Image splitting process of the training area.
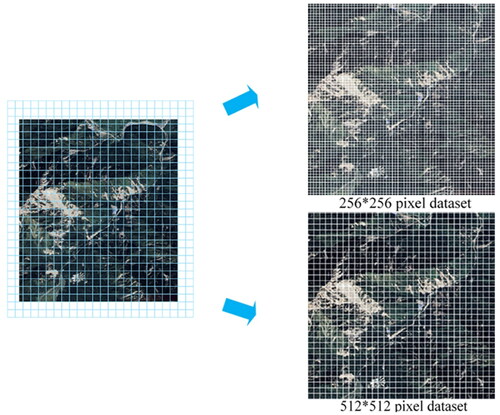
Table 1. Information parameter table of remote sensing images.
Figure 3. Three types of complex background. (a) Artificial buildings; (b) terraced fields and water surfaces; (c) bare land and roads.
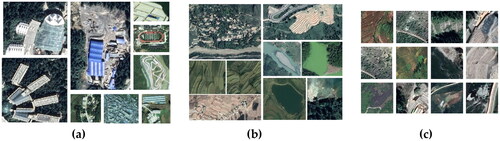
Figure 4. Background enhancement method 1 based on CutMix. (a) Non-landslide sample; (b) landslide sample; (c) new sample obtained by CutMix; (d) mask of new landslide sample.
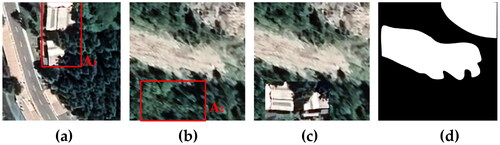
Figure 5. Background enhancement method 2 based on CutMix. (a) Landslide sample; (b) non-landslide sample; (c) new sample obtained by CutMix; (d) mask of new landslide sample.
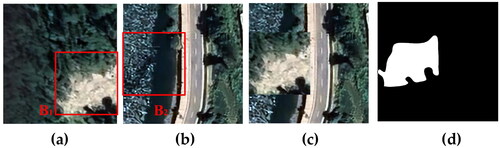
Figure 6. Background enhancement method 1 based on Mosaic. (a) Three non-landslide samples; (b) one landslide sample; (c) new sample obtained by Mosaic; (d) mask of new landslide sample.
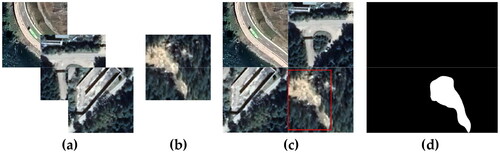
Figure 7. Background enhancement method 2 based on Mosaic. (a) One non-landslide sample; (b) three landslide samples; (c) new sample obtained by Mosaic; (d) mask of new landslide sample.
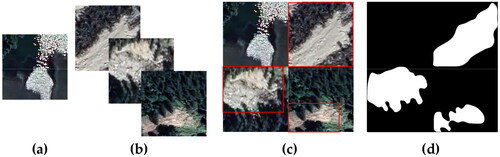
Figure 8. Background enhancement method based on MSSCBE. (a) Non-landslide sample from 256 × 256 pixels dataset; (b) landslide sample from 256 × 256 pixels dataset; (c) CutMix background enhanced sample; (d) landslide sample from 512 × 512 pixels dataset; (e) new sample obtained by MSSCBE; (f) mask of new landslide sample.
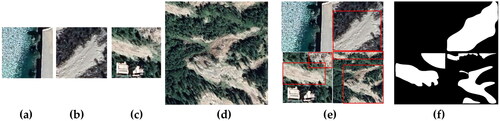
Figure 9. The flowchart of construct and evaluate landslides detection model.
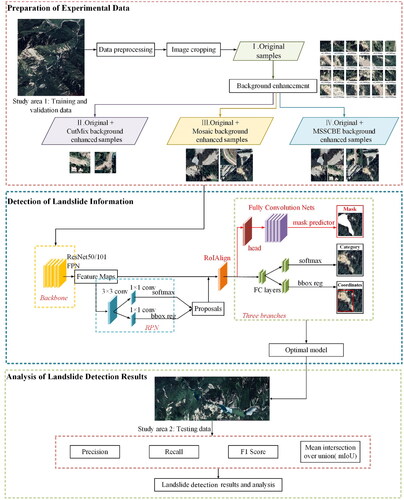
Table 2. Datasets for comparative experiments using Mask R-CNN.
Table 3. Confusion matrix between true value and predicted value.
Figure 10. Landslides truth and landslide detection results using Mask R-CNN. (a) Landslides truth; (b) results of Experiment I; (c) results of Experiment II; (d) results of Experiment III; (e) results of Experiment IV.
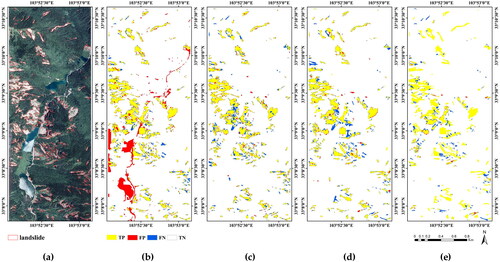
Table 4. Comparative statistics of landslide detection results using Mask R-CNN.
Figure 11. Comparisons of landslide detection results and ground truth of six samples. (a1–f1) Original remote sensing images and ground truth; (a2–f2) results of Experiment I; (a3–f3) results of Experiment II; (a4–f4) results of Experiment III; (a5–f5) results of Experiment IV. The detection results are presented as green masks. Red box represents false detections and white box represents omissive detections.
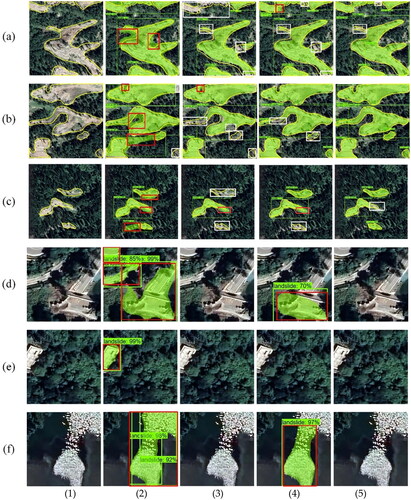
Table 5. Comparative statistics of landslide detection results using different deep learning models.
Table 6. Comparative statistics of landslide detection results in Bijie City.
Data availability statement
The data presented in this study are available on request from the corresponding author.