
Figures & data
Figure 1. Numerical simulation model setup.
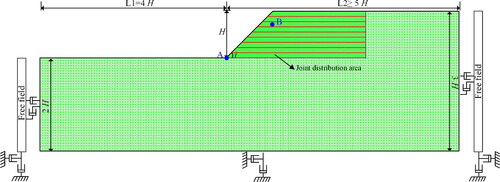
Table 1. Physical and mechanical parameters of rock and joint.
Figure 2. (a) Time-history acceleration of different ground motions and (b) corresponding Fourier spectrum.
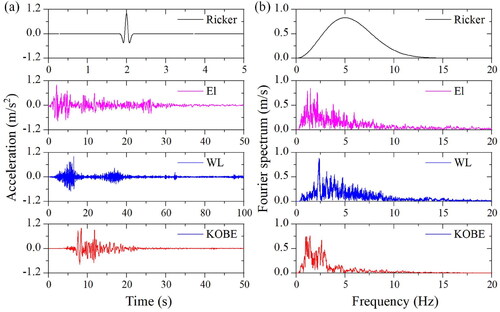
Table 2. Numerical simulation models and the corresponding parameters.
Figure 3. Effect of normalized stiffness K on spatial variation of AAF-X of the slope: (a) K=0.5, (b) K=1, (c) K=10, and (d) homogeneous slope.
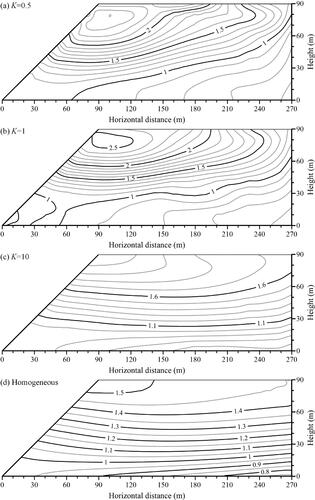
Figure 4. (a) The AAF-X along the slope surface with different normalized stiffness K and (b) the AAF-X at the slope crest and for different distances behind the slope crest.
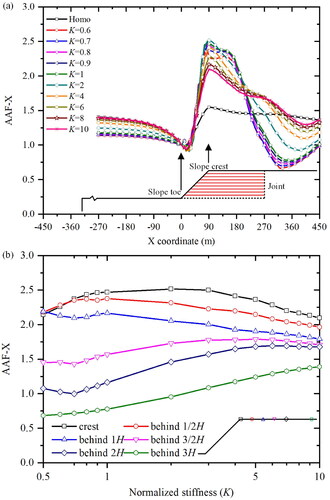
Figure 5. Effect of kn/ks on spatial variation of AAF-X of the slope: (a) kn/ks = 1, (b) kn/ks = 6, and (c) kn/ks = 10.
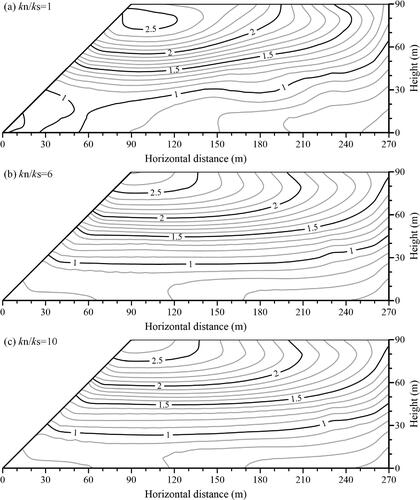
Figure 6. (a) The AAF-X along the slope surface with different kn/ks and (b) the AAF-X at the slope crest and for different distances behind the slope crest.
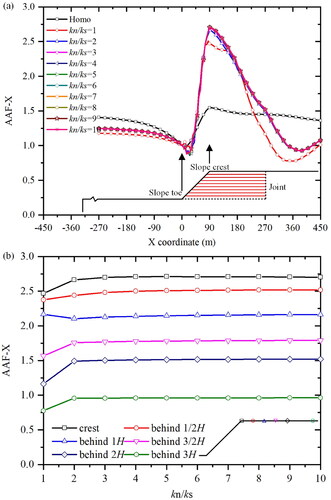
Figure 7. Effect of normalized joint spacing ξ on spatial variation of AAF-X of the slope: (a) ξ = 0.005, (b) ξ = 0.01, and (c) ξ = 0.1.
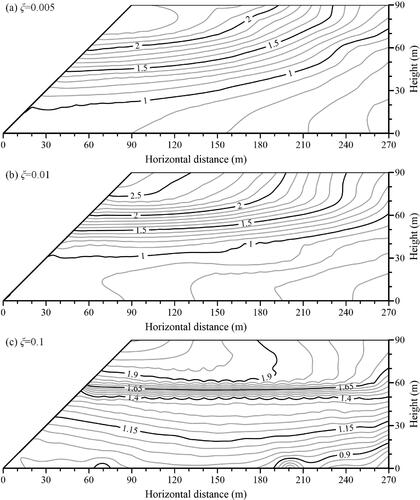
Figure 8. (a) The AAF-X along the slope surface with different normalized joint spacing ξ and (b) the AAF-X at the slope crest and for different distances behind the slope crest.
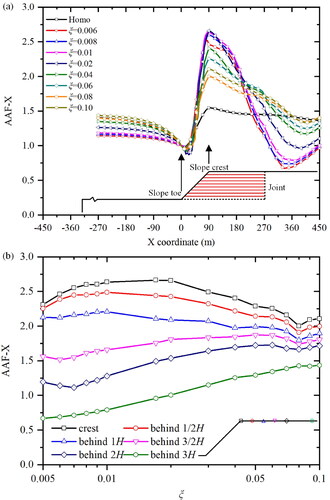
Figure 9. Effect of slope angle i on spatial variation of AAF-X of the slope: (a) i = 15°, (b) i = 30°, (c) i = 45°, (d) i = 60°, (e) i = 75°and (f) i = 90°.
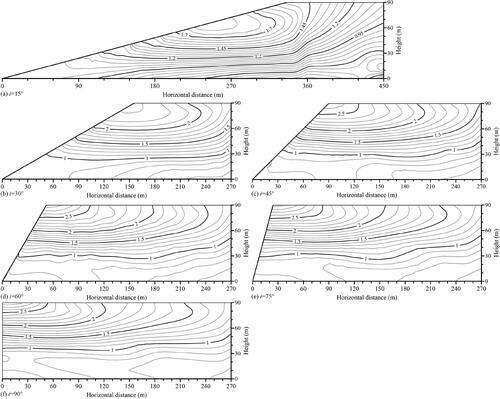
Figure 10. (a) The AAF-X along the slope surface for jointed slope with different slope angle i, (b) the AAF-X along the slope surface for homogeneous slope with different slope angle i, and (c) the AAF-X at the slope crest for jointed and homogeneous slope.
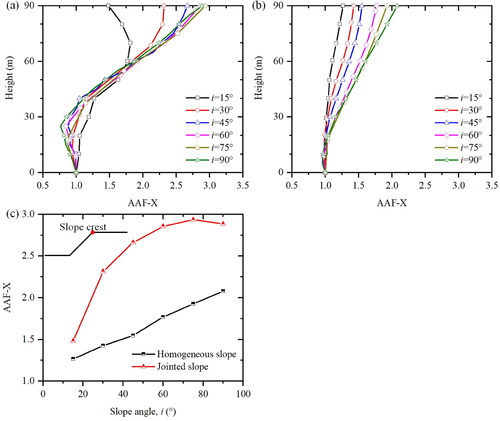
Figure 11. (a) The AAF-X along the slope surface for jointed slope with different slope height H, (b) the AAF-X along the slope surface for homogeneous slope with different slope height H, and (c) the AAF-X at the slope crest with different H/λ by varying the slope height.
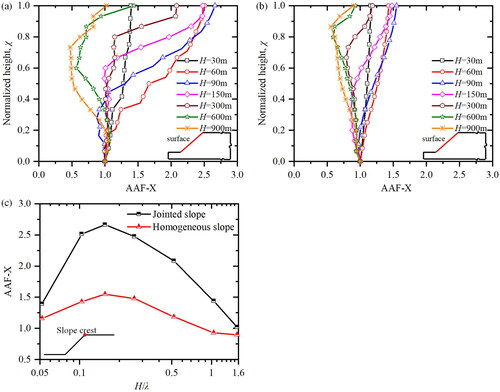
Figure 12. Seismogram synthetics of acceleration for different K: (a) K = 0.5, (b) K = 1, (c) K = 3, and (d) K = 10.
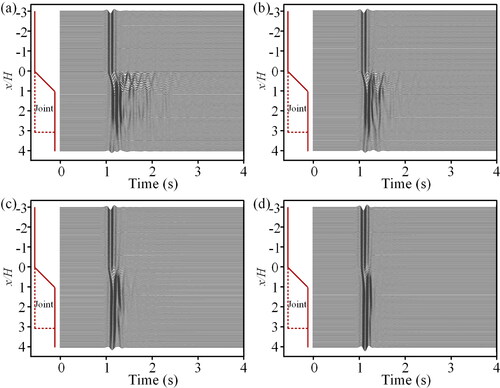
Figure 13. Seismogram synthetics of acceleration for different ξ: (a) ξ=0.005, (b) ξ=0.01, (c) ξ=0.02, and (d) ξ=0.1.
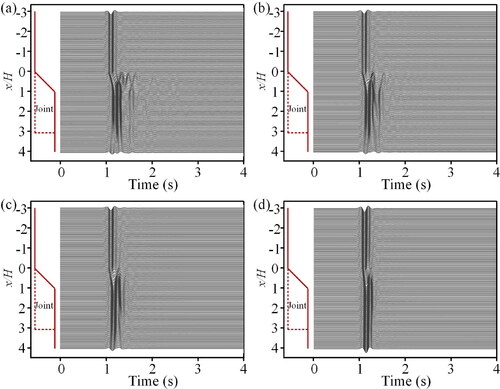
Figure 14. The topographic and jointed amplification function: (a) TAtopo_ho of the homogeneous model, (b) TAtopo_jo of the jointed model, (c) TAsite for 1D and 2D models, and (d) TAcoupled.
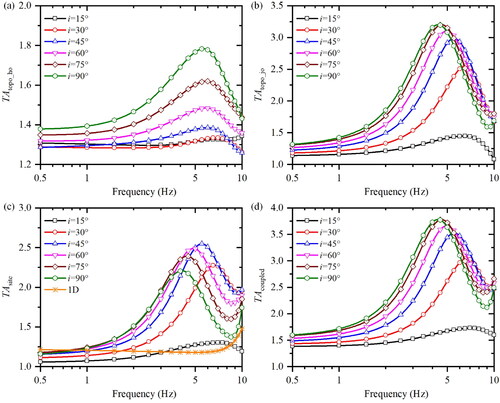
Table 3. Recorded PGAs at the free surface of the 1D soil column and 2D slope models.
Figure 15. Seismogram synthetics of acceleration for different slope heights. Left (homogeneous slope): (a) H=30m, (b) H=90m, (c) H=300m, and (d) H=900m; Right (jointed slope): (e) H=30m, (f) H=90m, (g) H=300m, and (h) H=900m.
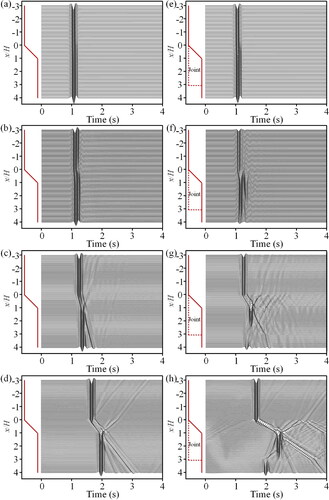
Figure 16. Top (AAF-X along the slope surface): (a) homogeneous slope and (b) jointed slope with different H/λ; bottom (AAF-X at slope crest and behind the slope crest): (c) homogeneous slope and (d) jointed slope.
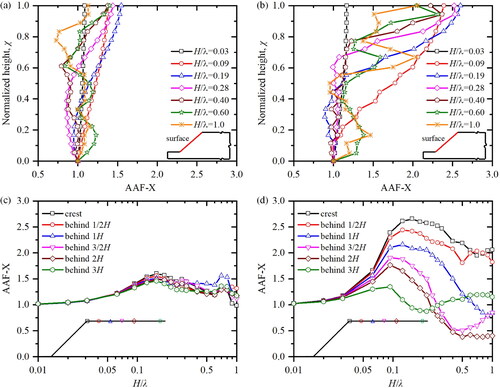
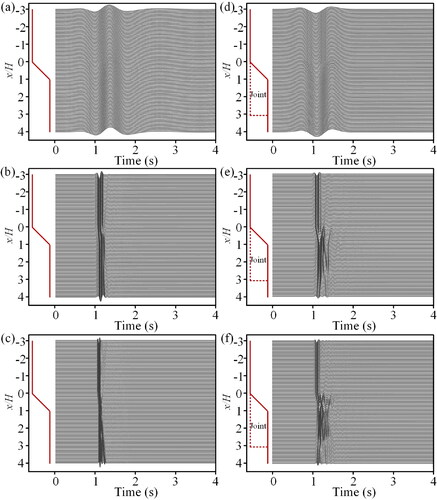
Figure 17. Seismogram synthetics of acceleration along slope surface. Left (homogeneous slope): (a) H/λ = 0.03, (b) H/λ = 0.22, and (c) H/λ = 0.6; right (jointed slope): (d) H/λ = 0.03, (e) H/λ = 0.22, and (f) H/λ = 0.6.
Data availability statement
The datasets generated and analyzed during the current study are available from the corresponding author on reasonable request.