
Figures & data
Figure 1. Plane layout of main structures at Xulong hydropower station.
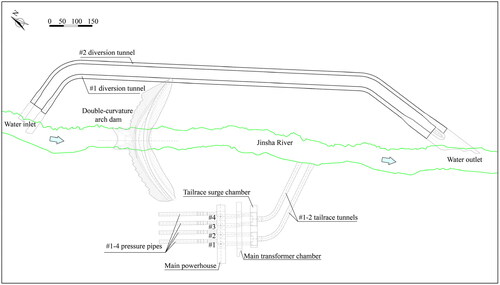
Figure 2. A typical geological profile along the axis of the #1 diversion tunnel.
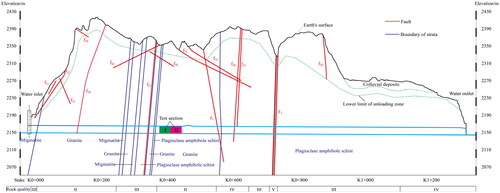
Figure 3. Arrangement of blasting holes in the test section (unit: cm).
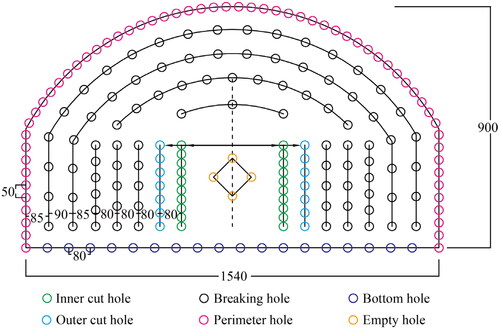
Figure 4. Design of blasting vibration tests (unit: cm). (a): blasting scheme A in test section I, and (b) blasting scheme B in test section II.
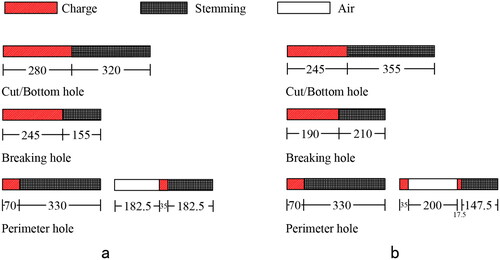
Table 1. Blasting holes and their parameters.
Figure 5. Layout of blasting vibration testing sensors.
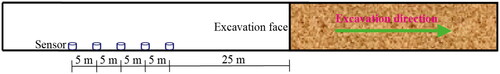
Figure 6. Arrangement of the acoustic test holes.
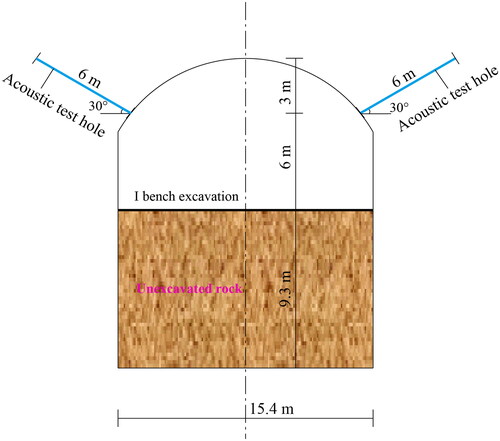
Figure 7. Spatial layout of MS monitoring geophones.
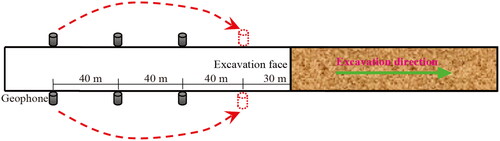
Figure 8. Relationship curve between average vibration velocity and distance using Sodev’s empirical formula. (a): Blasting scheme A in test section I, and (b) blasting scheme B in test section II.
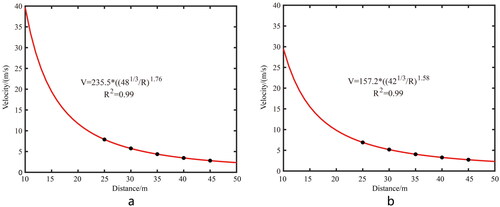
Table 2. Results of blasting vibration tests.
Figure 9. Acoustic wave velocity curves of rock mass.
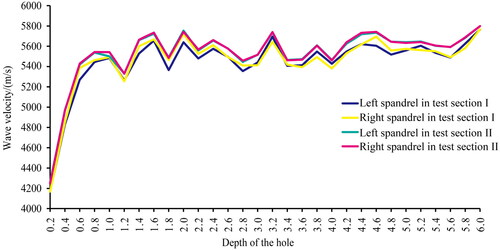
Figure 10. Average acoustic wave velocity in different test time.
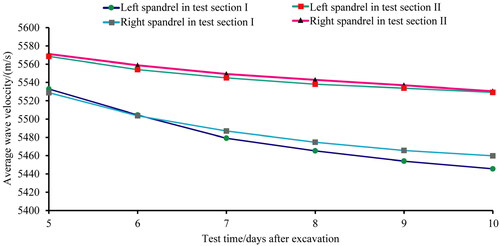
Figure 11. Underbreak of typical profiles in the test section (unit: cm).
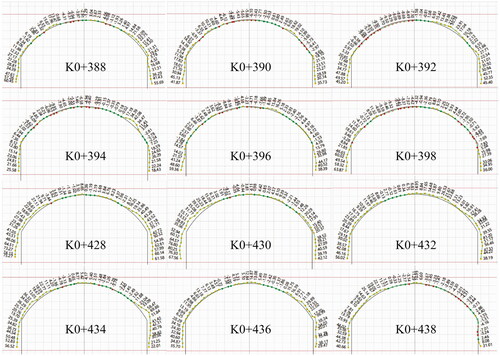
Figure 12. Rock mass displacement of typical profiles in the test section.
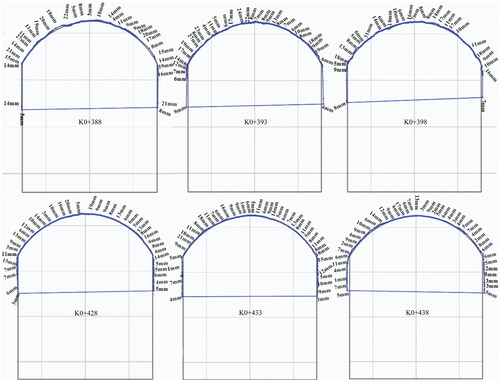
Figure 13. MS events induced by blasting excavation in the test section.
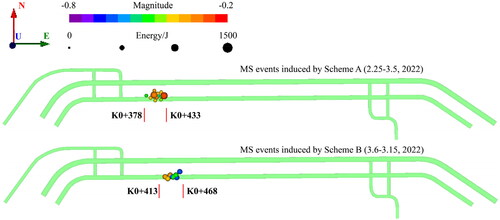
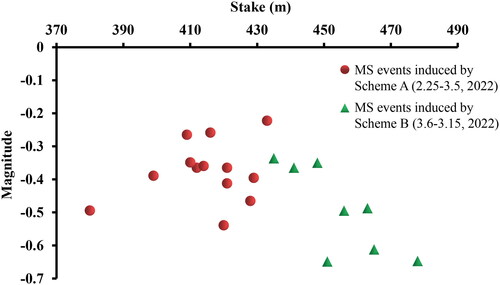
Figure 14. MS magnitudes and stakes induced by blasting excavation in two test sections.
Data availability statement
The data used to support the findings of this study are available from the corresponding author upon request.