
Figures & data
Figure 1. The study area.
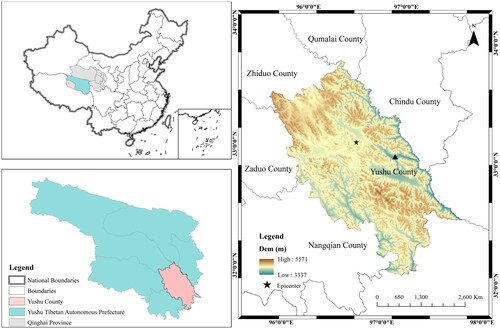
Table 1. Data source in this study.
Figure 2. Workflow of this study.
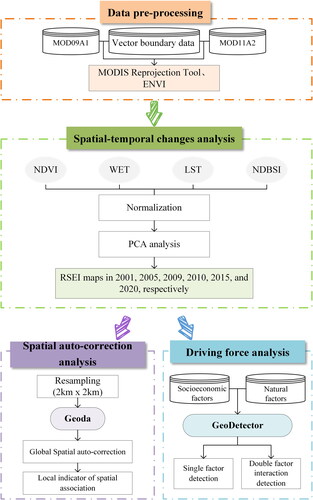
Table 2. The patterns of interaction detector.
Table 3. Principal component analysis results and RSEI mean from 2001 to 2020.
Figure 3. Spatial distribution of EEQ levels in Yushu County from 2001 to 2020.
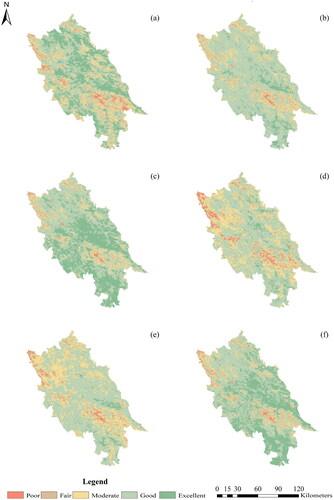
Table 4. EEQ area statistics for each level from 2001 to 2020.
Figure 4. Areas of different RSEI quality levels in Yushu County from 2001 to 2020.
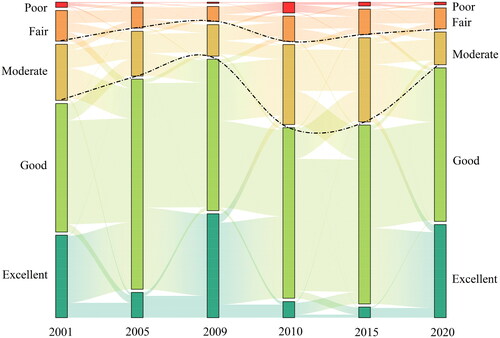
Figure 5. Changes in the ecological environment in Yushu County from 2009 to 2010.
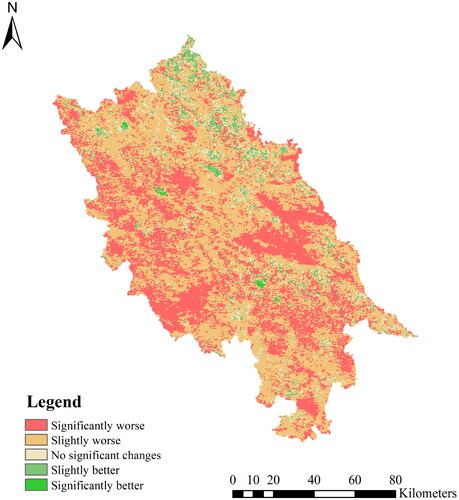
Table 5. Changes in the ecological quality of Yushu County from 2009 to 2010.
Table 6. Area statistics of different ecological environment change grades under different seismic intensities.
Table 7. Global moran’s I of RSEI in Yushu county from 2001 to 2020.
Figure 6. The seismic intensity of the Ms 7.1 earthquake in Yushu County, Qinghai.
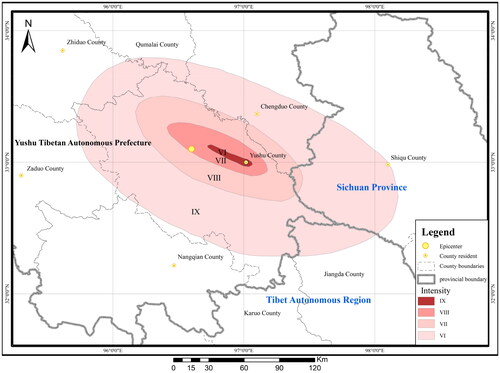
Figure 7. The proportion of the ecological change grades under different seismic intensities.
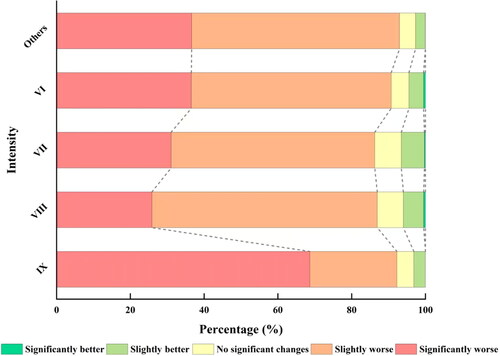
Figure 8. Scatter plots of the RSEI in Yushu County from 2001 to 2020.
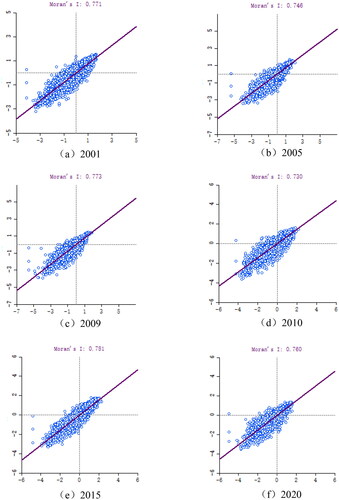
Figure 9. LISA of the RSEI in Yushu County from 2001 to 2020.
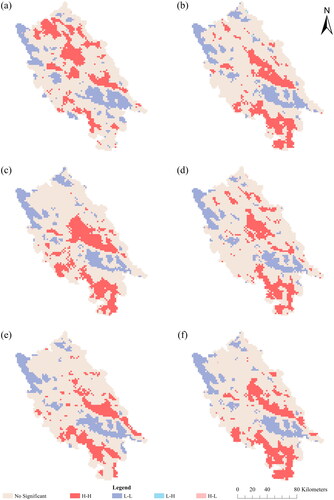
Table 8. The detection result of different factors of EEQ.
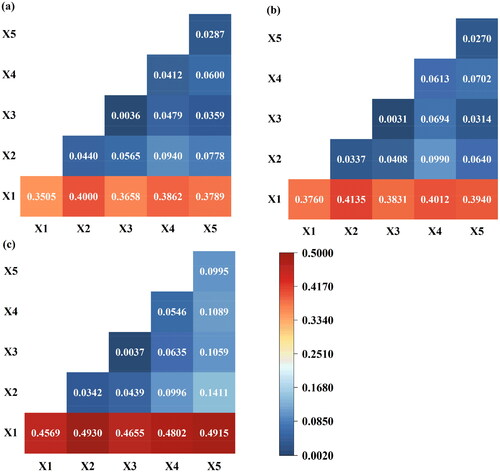
Figure 10. Results of the interaction detection. (a) 2010, (b) 2015, and (c) 2020.
Data availability statement
The data that support the findings of this study are available upon reasonable request.