
Figures & data
Figure 1. (a) The seepage water outside the embankment; (b) the collapse situation near a water supply riser due to failure to detect the underwater hollowed-out spot.
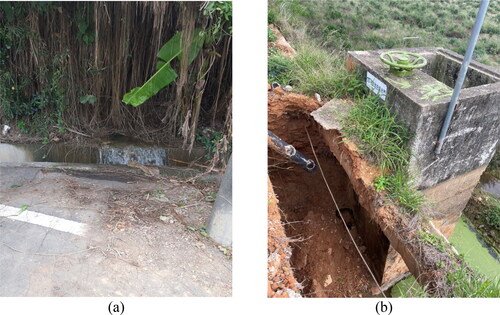
Figure 2. The Geographical location of the two ponds in this study: (a) Pond 9-6; (b) pond 9-8. The green triangle shows the ground control points around the ponds.
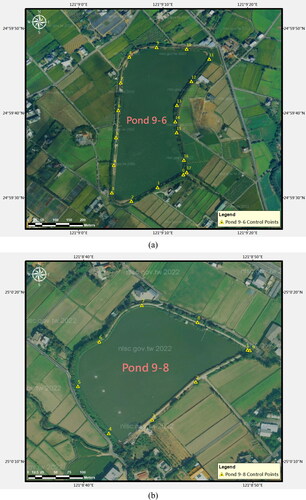
Figure 3. The workflow of integrating USV with MBES, GPR and ERT for monitoring and risk assessment of irrigation ponds.
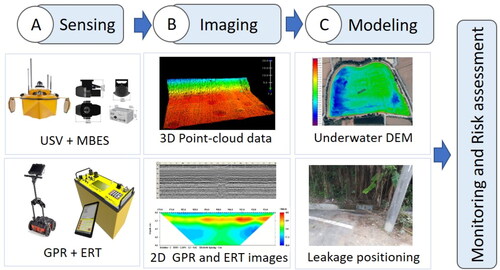
Figure 4. NORBIT iWBMS MBES system (NORBIT Citation2023).
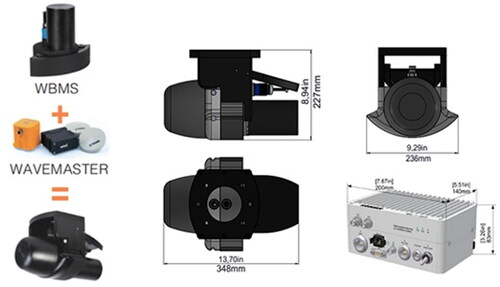
Table 1. Technical parameters of the NORBIT iWBMS MBES system (NORBIT Citation2023).
Figure 5. The survey line planning of pond 9-8 in the Taoyuan Canal.
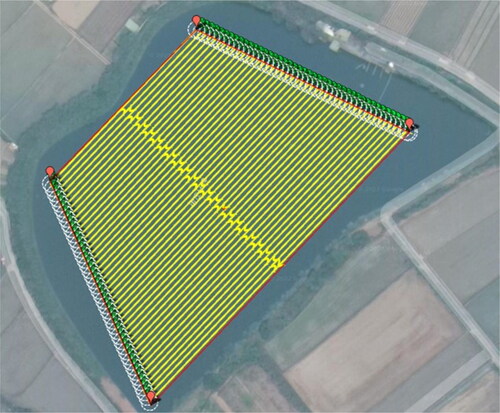
Figure 6. The flow chart of bathymetric data collecting and processing.
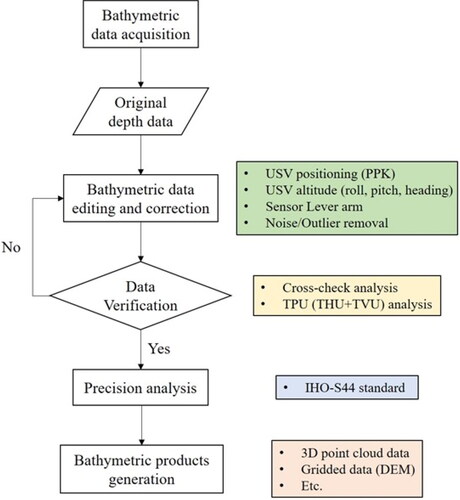
Figure 7. DEM of the bed of Pond 9-8 in the Taoyuan Canal, the distribution of isobaths at intervals of 0.2 m, and the 3D point cloud display of the holes at the pond bed.
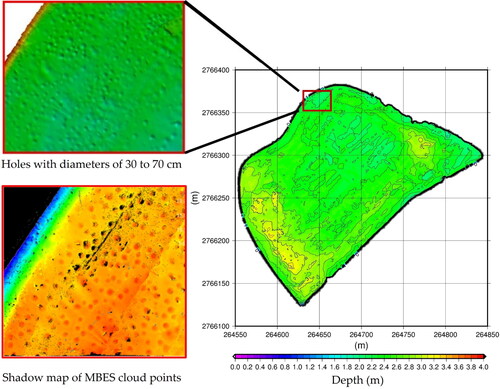
Figure 8. The distribution of differences between the point cloud data of the inspection lines and the grid data of ponds.
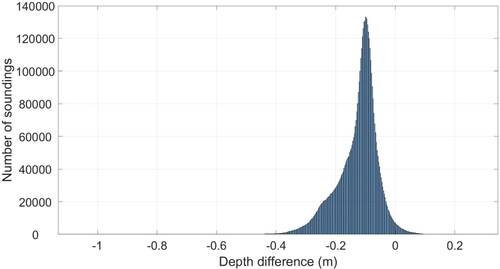
Table 2. Qualified rates for TPU according to special and grade 1 (1a, 1b) specifications.
Table 3. Statistics of differences between the original point cloud data of the inspection lines and the grid data of the whole area (unit: m).
Figure 9. The relationship between water level (H) and water area (a), and the relationship between water level (H) and effective water storage capacity (V) based on single-beam and multibeam measured results (with the lowest water abstraction level as the starting point for elevation).
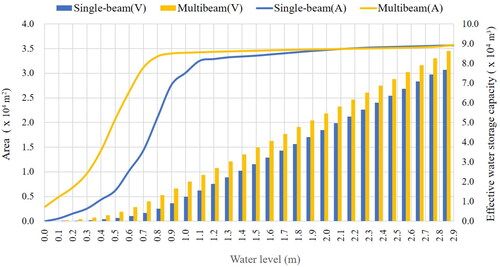
Figure 10. Distance (K: km) of GPR detection of ponds in the Taoyuan Canal, as well as Sections E1, E2, and E3 of the ERT survey lines: (a) pond 9-6; (b) pond 9-8.
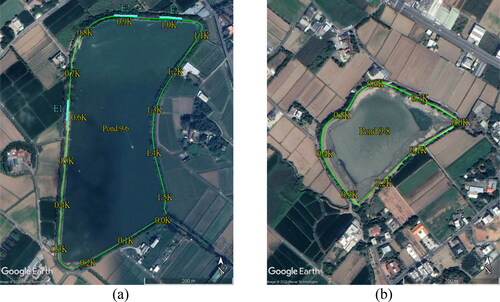
Figure 11. The GPR profile from 0K + 950 to 1K + 000 (K: km) of pond 9-6. The yellow rectangle encloses the section with densely distributed hole diffraction signals.
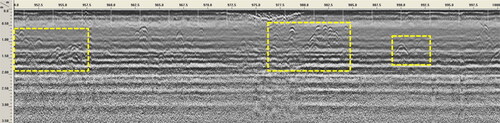
Figure 12. The GPR profile from 0K + 300 to 0K + 350 (K: km) of pond 9-8. The yellow rectangle encloses the section with densely distributed hole diffraction signals.
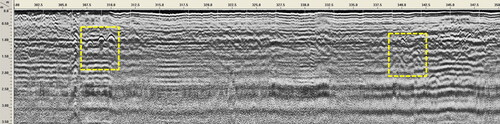
Figure 13. The 2D GPR stratigraphic profile from 0K + 571 to 0K + 630 and the ERT profile of Section E1 (K: km).
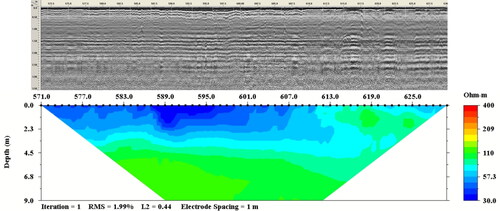
Figure 14. The 2D GPR stratigraphic profile from 0K + 870 to 0K + 929 and the ERT profile of Section E2 (K: km). The white rectangle encloses the abnormal areas marked by the GPR signals and its corresponding area in the ERT profile.
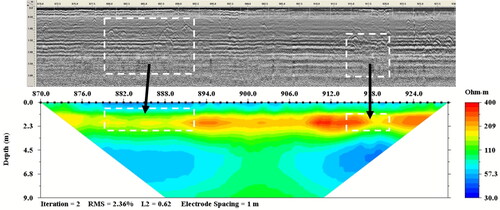
Figure 15. The 2D GPR stratigraphic profile from 0K + 991 to 1K + 050 and the ERT profile of Section E3 (K: km). The white rectangle encloses the abnormal areas marked by the GPR signals and its corresponding area in the ERT profile.
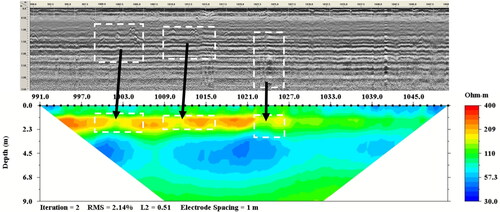
Table 4. Risk classification of the embankment structure according to the type of GPR abnormal signal.
Figure 16. (a) The distribution of bathymetric point cloud data on the Northern embankment of pond 9-6; (b) the collapse location shown by the point cloud data (the red rectangle); (c) the photo of the collapse at low water level taken on 15 Nov 2022.
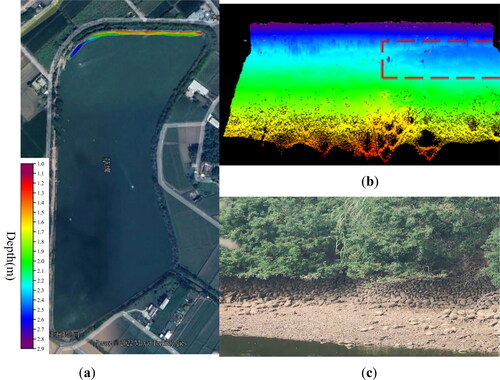
Table 5. The distance, depth, feature identification, and risk classification based on the GPR detection results of Pond 9-6 in the Taoyuan Canal.
Table 6. The distance, depth, feature identification, and risk classification based on the GPR detection results of Pond 9-8 in the Taoyuan Canal.
Data availability statement
The data that support the findings of this study are available from the corresponding author, H. C. Shih, with the permission of Taoyuan Management Office, Irrigation Agency, Ministry of Agriculture, Republic of China (Taiwan). Restrictions apply to the availability of these data, which were used under license for this study.