
Figures & data
Figure 1. The general architecture of the LST data processing and anomalies calculations.
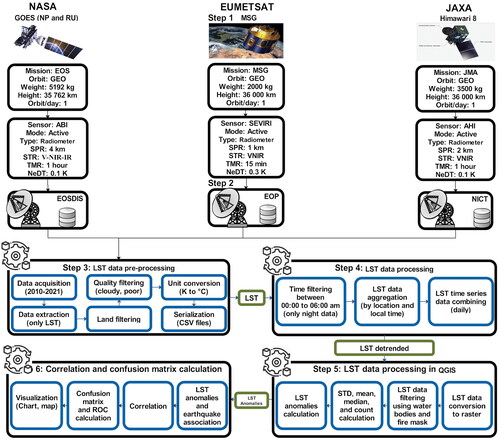
Table 1. LST data quality products.
Figure 2. Geographic distribution of earthquakes occurring between 2010 and 2021 with Mw ≥ 4.
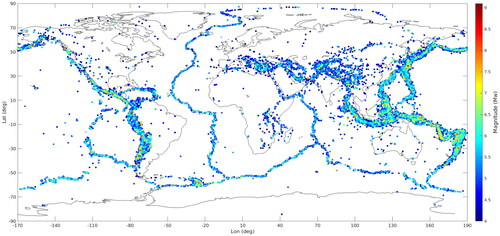
Table 2. Classification details of magnitude, depth, and altitude.
Figure 3. Statistics of the 30,248 land earthquakes between 2010 and 2021.
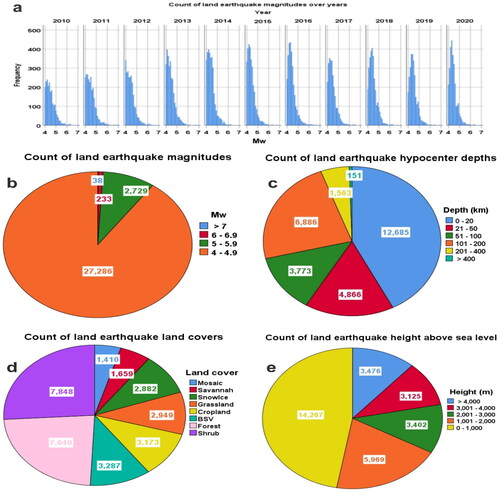
Figure 4. The map location of the 8 case studies presented.
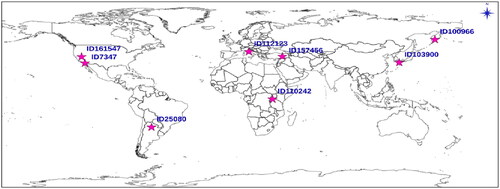
Table 3. Details of the 8 case studies presented.
Figure 5. LST data processing and anomalies calculation flowchart in GIS software.
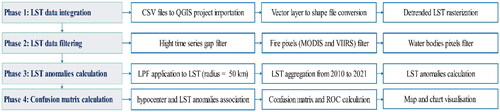
Figure 6. Visualization of LST maps during GIS processing.
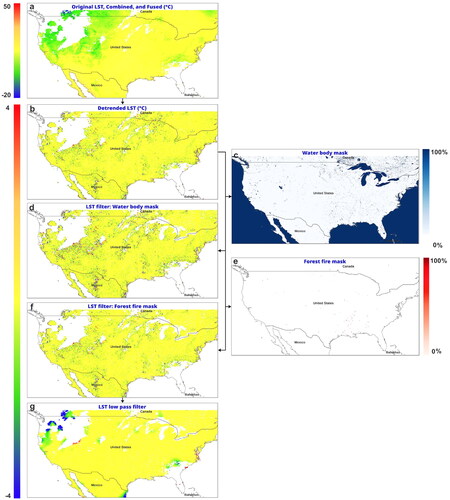
Figure 7. Map visualization of a) pixel percent, b) STD of detrended LST (°C), c) median of detrended LST (°C), and d) mean of detrended LST (°C) between 2010 and 2021.
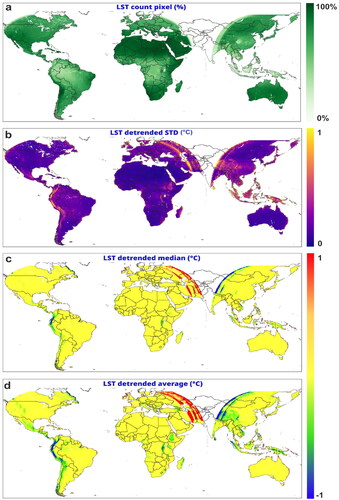
Table 4. The details of the used raster configuration and grid sizes.
Table 5. Definition of the confusion matrix elements and derived parameters.
Figure 8. The CMs of different methods, grid sizes, and FSR.
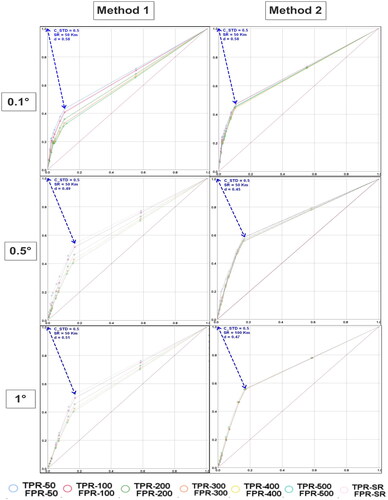
Figure 9. Confusion Matrix parameters, ACC, G-mean, D, AUC, and DOR figures of merits for LST anomalies by earthquake magnitude (from Mw = 4 to 8).
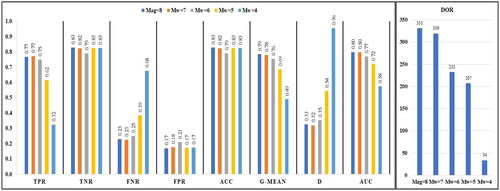
Figure 10. Confusion Matrix parameters, ACC, G-mean, D, AUC, and DOR figures of merits for LST anomalies by hypocenter depths (from DP0 to DP5).
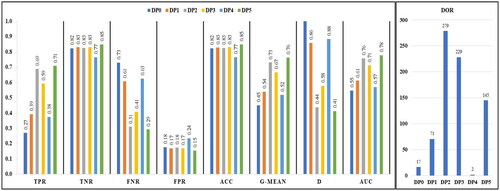
Figure 11. Land composition.
Figure 12. Confusion Matrix parameters, ACC, G-mean, D, AUC, and DOR figures of merits for LST anomalies by land cover type.
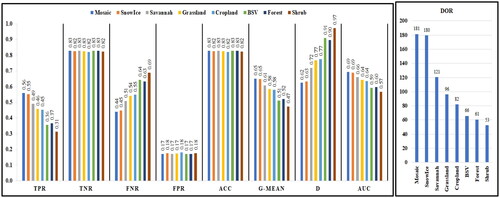
Figure 13. Confusion Matrix parameters, ACC, G-mean, D, AUC, and DOR figures of merits for LST anomalies by altitude.
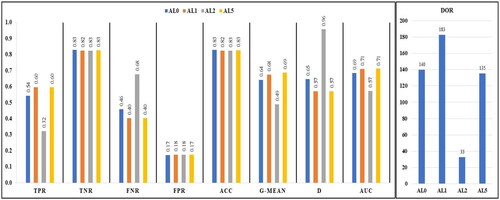
Table 6. The average LST anomalies (°C) classified for Mw > 6, and 8 a) land covers, and b) 3 elevation classes.
Table 7. The average LST anomalies (°C) classified over Mw > 6.
Table 8. The measured LST anomalies (°C) for all strong studied earthquakes between 2010 and 2021.
Figure 14. LST detrended and LST anomaly maps for the earthquake ID25080.
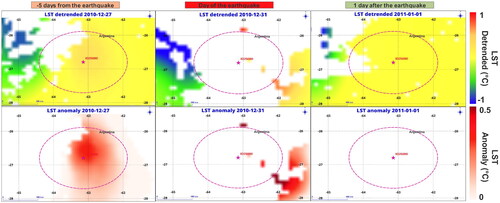
Figure 15. LST detrended and LST anomaly maps for the earthquake ID100966.
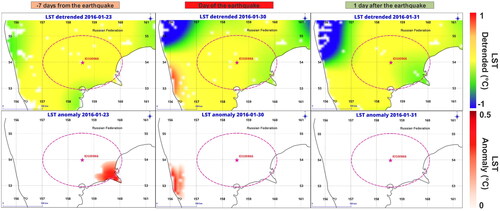
Figure 16. LST detrended and LST anomaly maps for the earthquake ID112123.
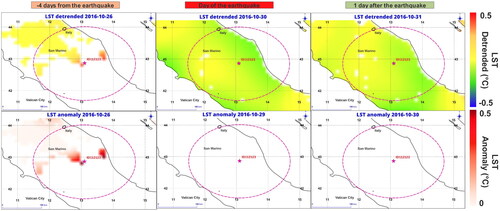
Figure 17. LST detrended and LST anomaly maps for the earthquake ID157456.
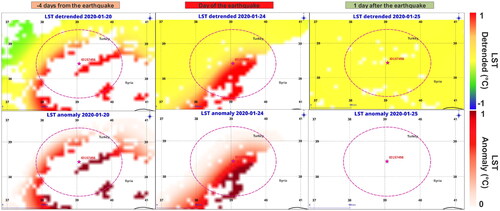
Figure 18. Mean LST anomalies with a searching radius of 50 km in time series for the 8 studied earthquakes 1 week before and after their occurrence.
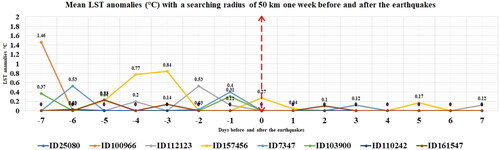
Table 9. Comparison table of this study with some related works.
Supplemental Material
Download (19.7 MB)Data availability statement
The GOES/ABI, MSG/SEVIRI, and Himawari-8/AHI data used in this study comes from the Copernicus global land service https://land.copernicus.eu/global/products/lst and earthquake data comes from the open USGS earthquake database available at https://earthquake.usgs.gov/earthquakes/search/.