
Figures & data
Table 1. The columnar and mechanical parameters of coal and rock strata.
Figure 1. Layout and support section of the roadway: (a) relationship between the roadway layout and fault location and (b) roadway position and support section.
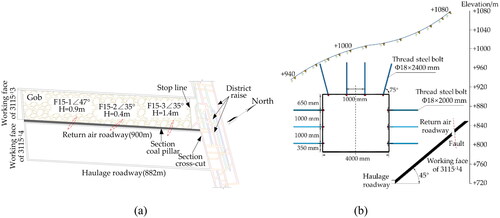
Figure 2. Physical similarity simulation experimental model and monitoring equipment.
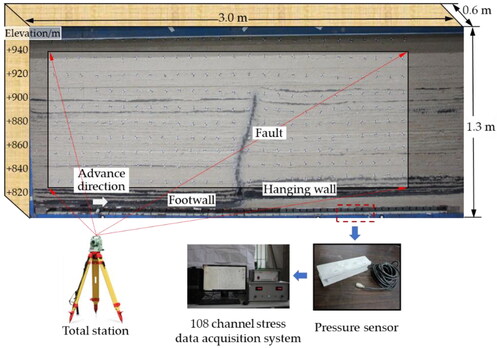
Figure 3. Mining load transfer law of the working face: (a) roof caving form of the working face crossing a fault and (b) distribution characteristics of the abutment pressure in the working face.
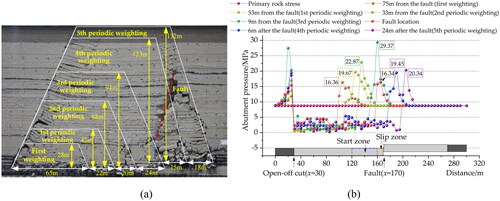
Table 2. Characteristic parameters of ground pressure behaviour in working face.
Figure 4. Load transfer path of the working face crossing a fault: (a) working face away from the fault and (b) working face near the fault.
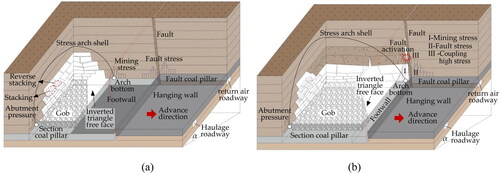
Figure 5. Characteristic impacts of mining load strength.
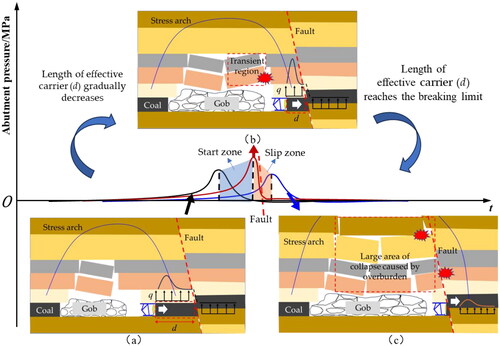
Figure 6. 3D numerical calculation model.
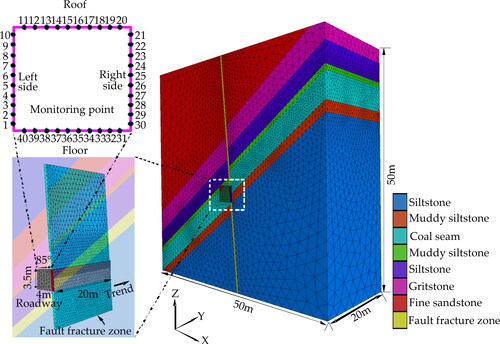
Figure 7. Stress distribution characteristics of roadway surrounding rock at different fault locations: (a) no fault, (b) fault 1 m from the left side, (c) fault 1 m from the right side, (d) fault located on the left side, (e) fault located in the middle of the roadway, and (f) fault located on the right side.
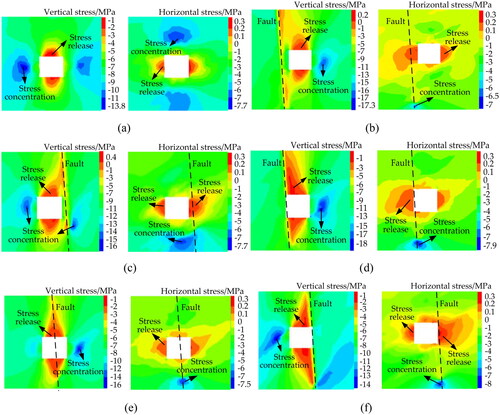
Figure 8. Deflection characteristics of the first principal stress in the roadway surrounding rock at different fault positions: (a) no fault, (b) fault 1 m from the left side, (c) fault 1 m from the right side, (d) fault located on the left side, (e) fault located in the middle of the roadway, and (f) fault located on the right side.
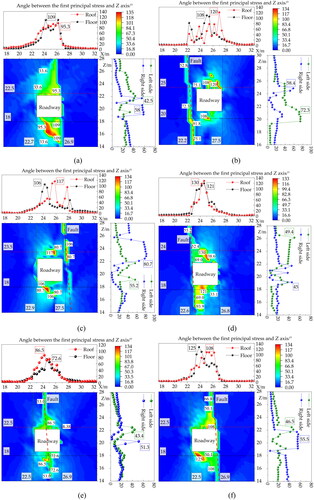
Table 3. The maximum deflection angle (θmax) of the first principal stress in surrounding rock at different fault locations.
Figure 9. Roadway surrounding rock displacement distribution at different fault positions: (a) no fault, (b) fault 1 m from left side, (c) fault 1 m from right side, (d) fault located on left side, (e) fault located in the middle of roadway, and (f) fault located on the right side.
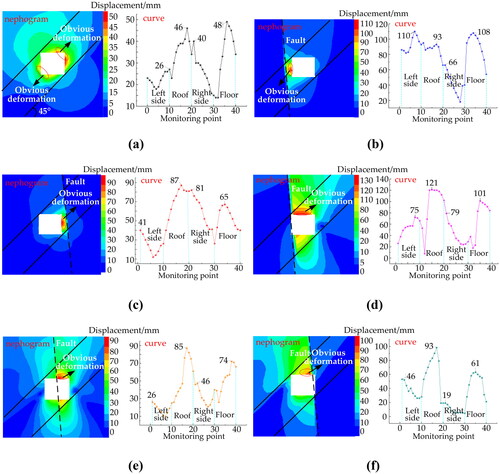
Table 4. Surface deformation of roadway surrounding rock at different fault locations. (unit: mm).
Figure 10. Stress distribution characteristics of roadway surrounding rock under different load strengths: (a) load strength coefficient of 2.61, (b) load strength coefficient of 3.36, (c) load strength coefficient of 1.87, and (d) load strength coefficient of 2.22.
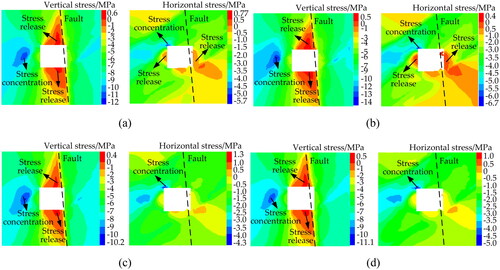
Figure 11. Deflection characteristics of the first principal stress of the roadway surrounding rock under different load strengths: (a) load strength coefficient of 2.61, (b) load strength coefficient of 3.36, (c) load strength coefficient of 1.87, and (d) load strength coefficient of 2.22.
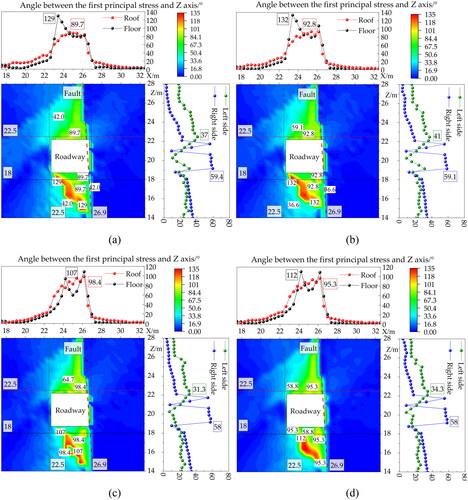
Table 5. The maximum deflection angle (θmax) of the first principal stress in surrounding rock with different load strength.
Figure 12. Roadway surrounding rock displacement distribution under different load strengths: (a) load strength coefficient of 2.61, (b) load strength coefficient of 3.36, (c) load strength coefficient of 1.87, and (d) load strength coefficient of 2.22.
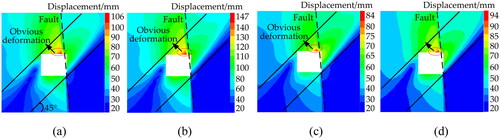
Table 6. Surface deformation of roadway surrounding rock with different load strength. (unit: mm).
Data availability statement
Relevant data are listed in the paper.