
Figures & data
Figure 1. The tectonic map around the Liupanshan area. The red dots are six strong earthquake. The blue arrows are GPS velocities relative to the ordos block (Hao et al. Citation2021). The fault data is from Deng et al. (Citation2003). HY = Haiyuan fault; LPS = Liupanshan fault; LX-BJ = Longxian-Baoji fault.
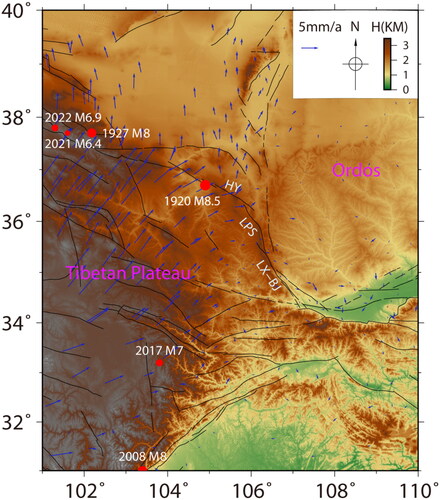
Figure 2. The spatial distribution and temporal evolution of the coulomb stress changes. (a). Spatial distribution of the Coulomb stress loading on the Liupanshan area associated with 6 strong earthquakes; (b). The temporal evolution of the coulomb stress associated with 6 strong earthquakes at the point P1 and P2 in the (a), respectively.
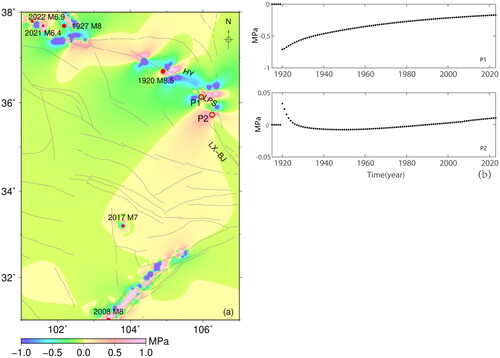
Figure 3. The sequence-number diagram for the earthquake catalog, 2010.7–2022.12.
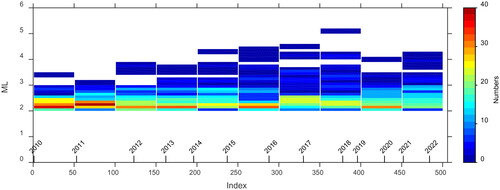
Figure 4. The b value (a) and seismicity rate (b) around the Liupanshan area during 2010.7–2022.12(M ≥ 2.3). The black circles denote the earthquakes. The color represents the b value and seismicity rate, respectively.
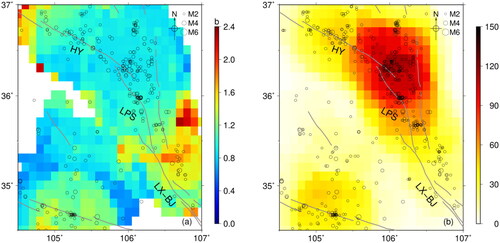
Figure 5. The probabilities of occurrence of M > 5 earthquakes around the Liupanshan area.
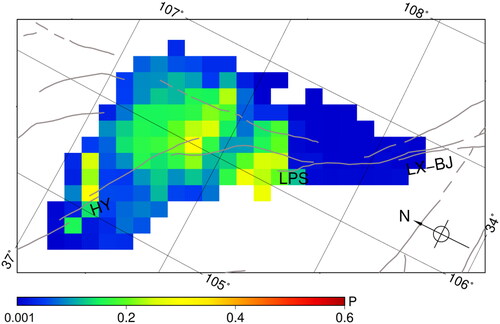
Figure 6. Impact of effective friction coefficients of 0.1(a), 0.4(b), 0.7(c) on the Coulomb stress due to the 1920 Haiyuan earthquake; (d) The temporal evolution of the Coulomb stress at point P1 based on different friction coefficients.
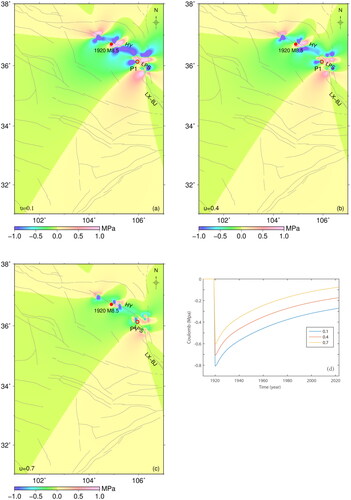
Table 1. The parameters of the lithosphere structure around the Liupanshan area.
Figure 7. The Coulomb stress changes based on the 3-segment (a) and 5-segment (b) rupture models for the 1920 Haiyuan earthquake, respectively.
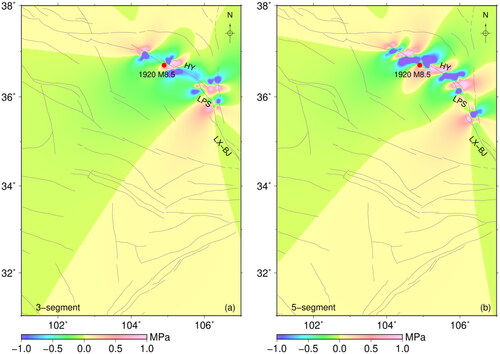
Figure 8. The coulomb stress changes due to the 1920 Haiyuan earthquake at different depths: (a) 5 km, (b) 10 km, (c) 15 km and (d) 20 km, respectively.
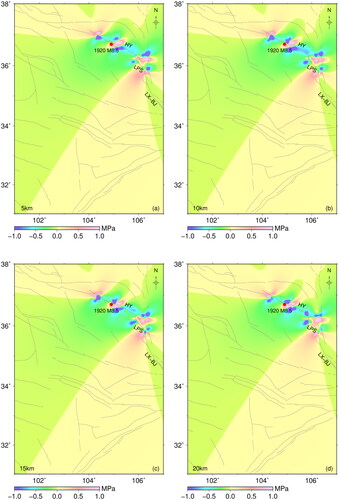
Figure 9. Focal mechanisms of earthquakes and the associated Coulomb stress changes. (a) Focal mechanisms of earthquakes. The black focal mechanism plots represent earthquakes catalog. (b) Smoothed faulting mechanisms of grids according to the nearest earthquakes. The Coulomb stress changes introduced by the coseismic deformation due to the 1920 Haiyuan earthquake based on the uniform fault plane (c) and variable fault planes which are assigned the strike, dip, and rake of each grid defined by the smoothed faulting mechanisms (d).
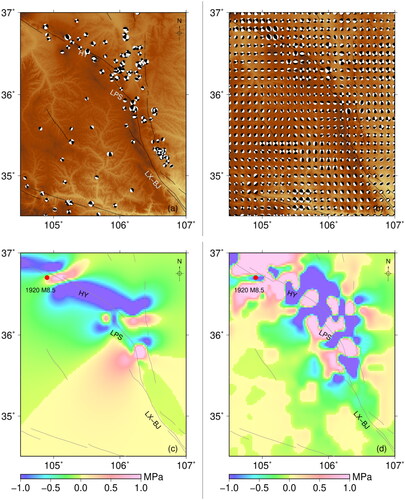
Figure 10. The coulomb stress changes loading on the Liupanshan fault due to the 1920 Haiyuan earthquake based on different viscosity parameters. This study (a), Ryder et al. (Citation2011) (b), Zhao et al. (Citation2021) (c) and Wang et al. (Citation2021) (d).
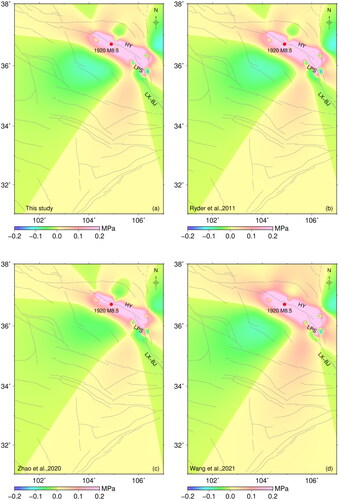
Table 2. The four models of different rheological viscosities.
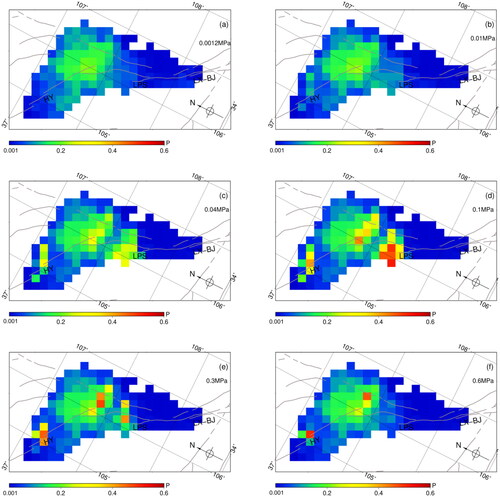
Figure 11. The earthquake occurrence probabilities associated with the different parameter (a)
is 0.0012 MPa, (b)
is 0.01 MPa, (c)
is 0.04 MPa, (d)
is 0.1 MPa, (e)
is 0.3 MPa, and (i)
is 0.6 MPa.
Supplemental Material
Download MS Word (1.2 MB)Data availability statement
The earthquake data utilized in this study are sourced from the National Earthquake Data Center of China (https://data.earthquake.cn/gcywfl/index.html).