Figures & data
Figure 1. Location map of Syria.
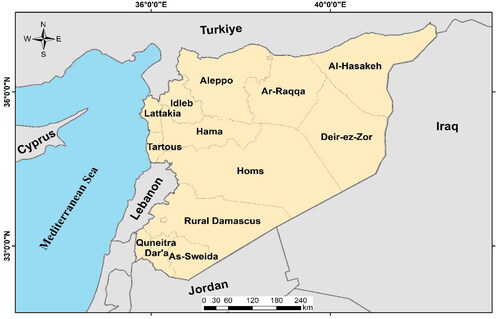
Figure 2. Annual rainfall and location of rainfall stations in Syria.
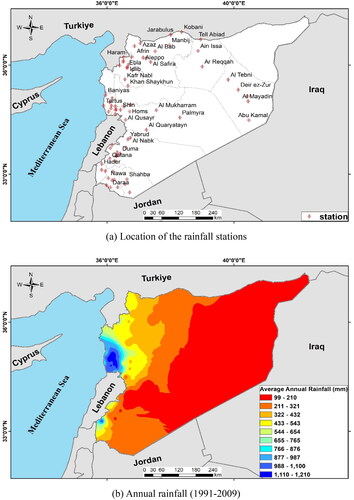
Figure 3. Location and annual rainfall at land stations in Tartous governorate.
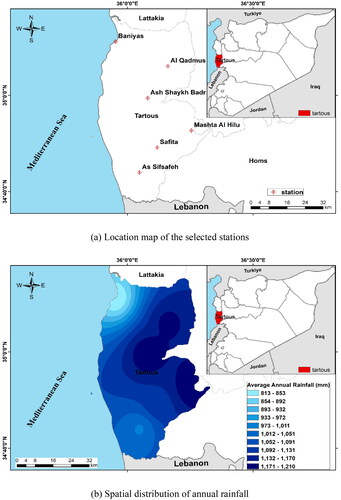
Table 1. Data of land stations in Tartous Governorate, Syria.
Figure 4. Flow chart of methodology used for rainfall forecasting using ARIMA models.
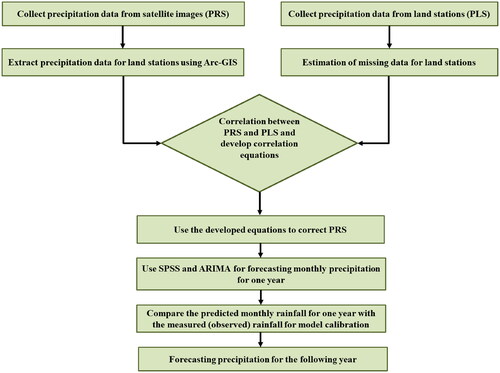
Figure 5. Satellite image for precipitation in January 2020 in Syria.
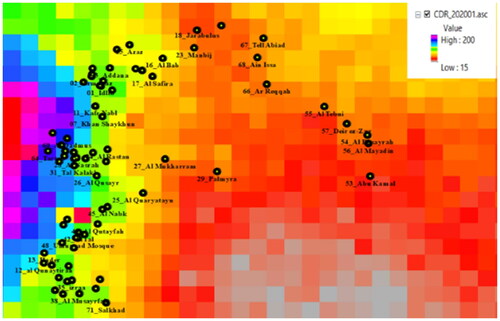
Figure 6. Correlation between RS data and land station data at ash Shaykh Badr station (1991–2009).
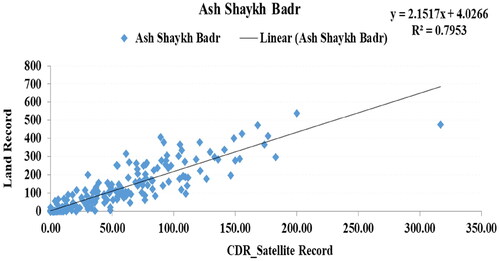
Table 2. Correlation equation and R2 at main stations in Tartous Governorate, Syria.
Figure 7. Forecast of monthly precipitation at Ash Shaykh Badr station (2021–2022).
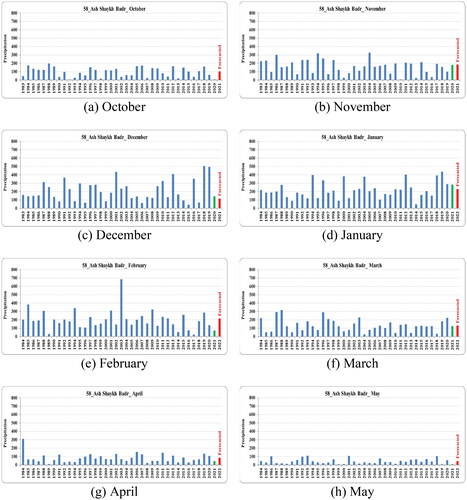
Figure 8. Forecast and validation of rainfall at Ash Shaykh Badr station.
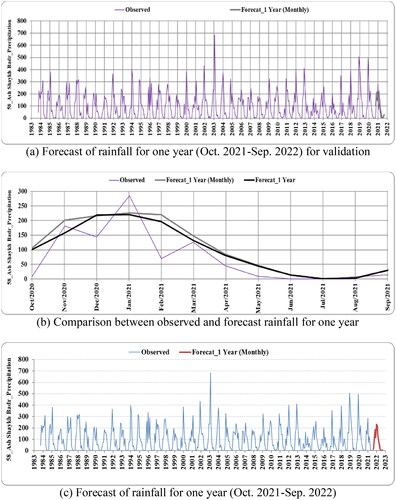
Figure 9. Forecast and validation of rainfall at as Sifsafeh station.
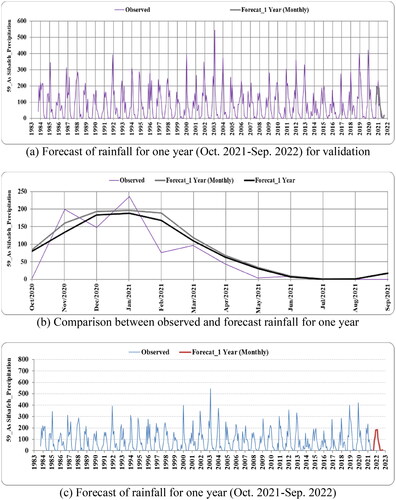
Figure 10. Forecast and validation of rainfall at Al-Qadmus station.

Figure 11. Forecast and validation of rainfall at baniyas station.
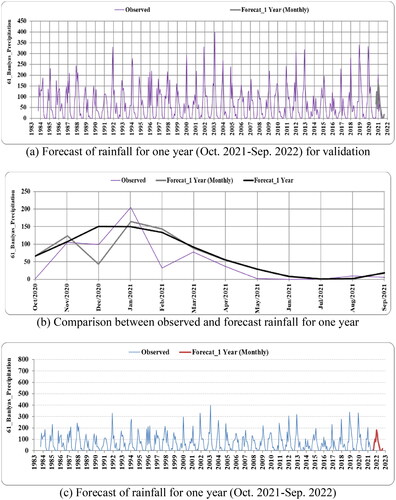
Figure 12. Forecast and validation of rainfall at Safita station.
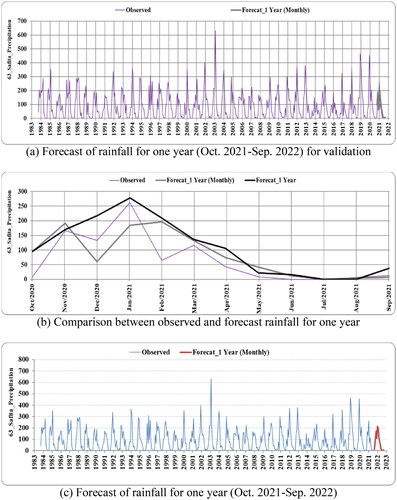
Figure 13. Forecast and validation of rainfall at Mashta Al Hilu station.
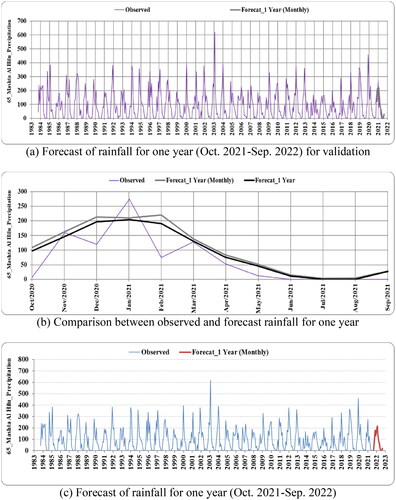
Figure 14. Spatial distribution of rainfall in Tartous governate (October 2021–September 2022).
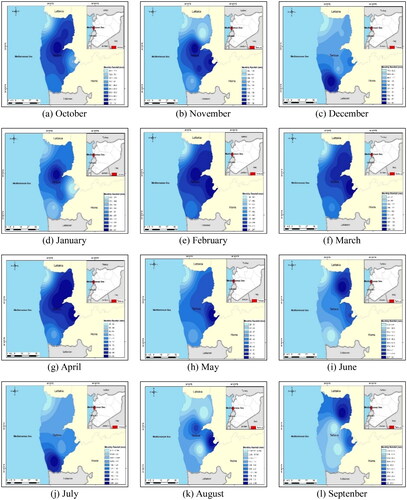
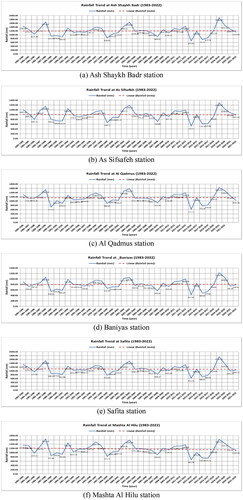
Figure 15. Rainfall trends at the six major stations in Tartous for the period (1983–2022).