
Figures & data
Figure 1. Position of mine and layout of working face: (a) test site position; (b) borehole column diagram of working face; (c) layout of working face; and (h) A-a side.
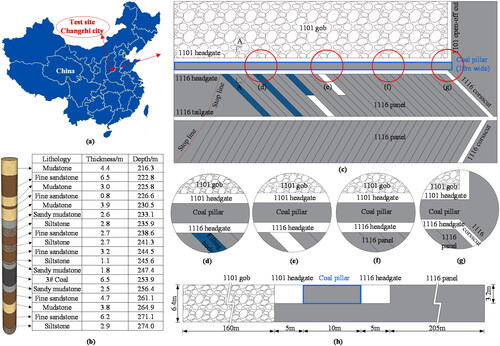
Figure 2. The support section of roadway.
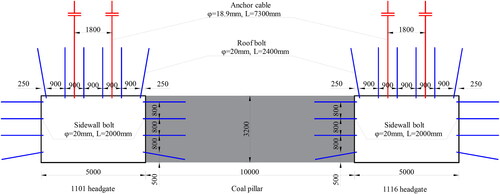
Figure 3. Deformation on site.
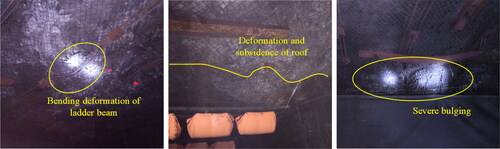
Figure 4. The fracture structure of main roof.
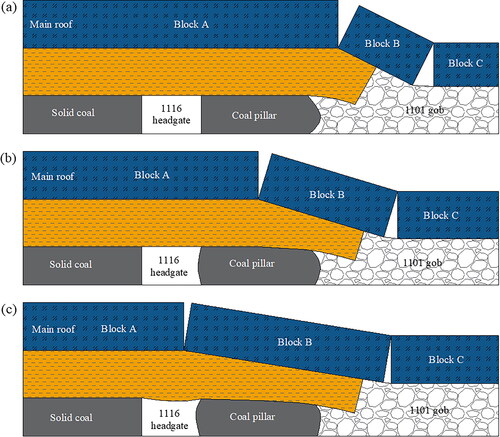
Figure 5. The mining way of CMCB.
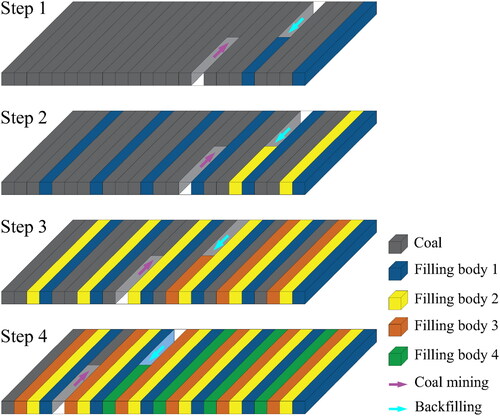
Figure 6. The particle distribution of filling materials: (a) fly ash; (b) cement.
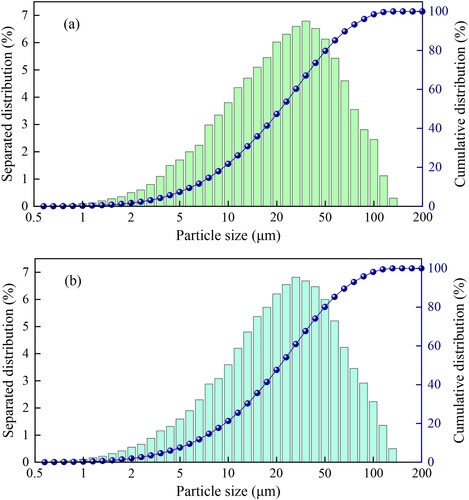
Figure 7. The age strength of filling body.
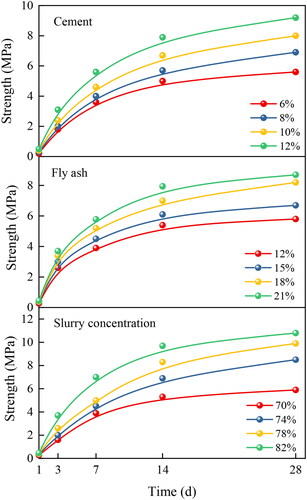
Figure 8. The process of numerical simulation.
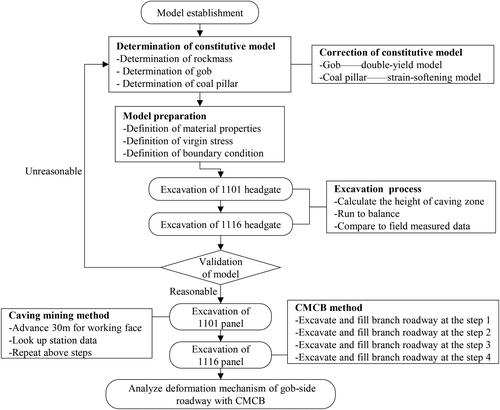
Figure 9. Numerical calculation model.
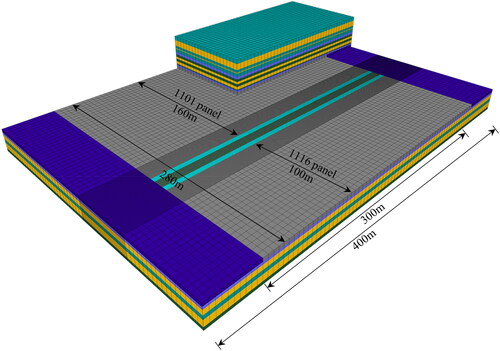
Table 1. The mechanical parameters of model.
Table 2. Calculation coefficient of average height of caving zone.
Table 3. Stress-strain Relationship of gob materials.
Figure 10. Results comparison between salamon model and numerical calculation.
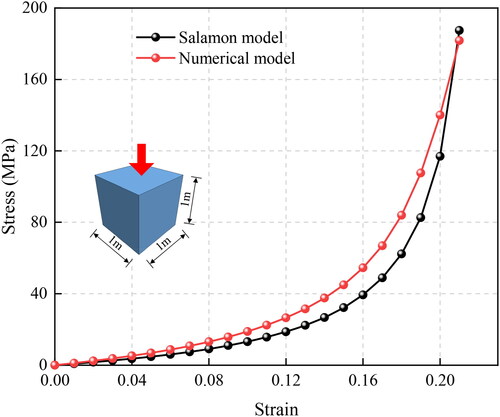
Table 4. The mechanical parameters of materials in gob.
Figure 11. Vertical stress distribution of 1101 gob.
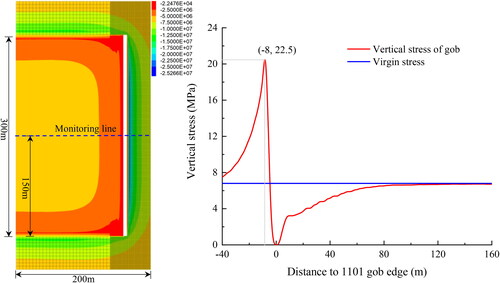
Figure 12. Strain-softening model correction: (a) numerical calculation model; (b) stress-strain curves of coal pillar with different width-height ratios; and (c) comparison of stress peaks with different width-height ratios.
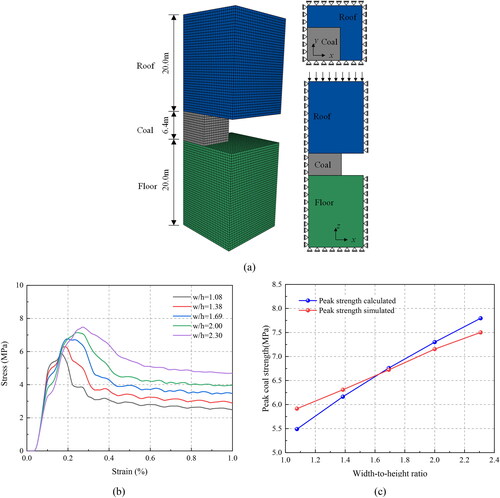
Table 5. The strain-softening model parameters of coal pillar materials.
Figure 13. The validation of global model: (a) GYW80 intrinsically safe surrounding rock stress sensor for mining; (b) the layout of field measured points; and (c) comparison between numerical simulation and field measured results.
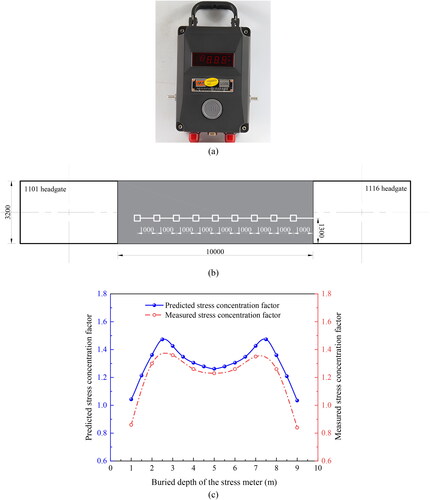
Figure 14. Vertical stress of two ribs during the mining of 1101 panel: (a) the distribution of plastic zone in working face; (b) vertical stress curves inside coal pillar; and (c) vertical stress curves of solid coal side.
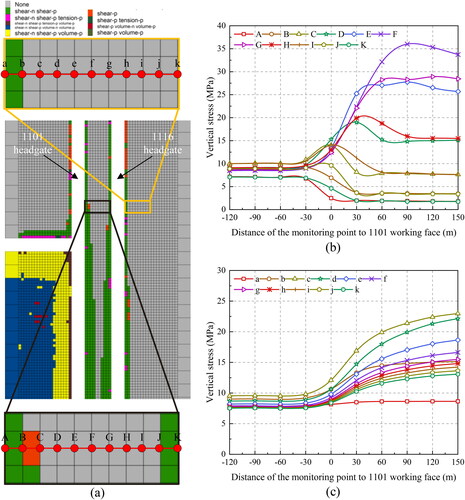
Figure 15. The plastic zone and stress distribution: (a) -120 m; (b) -90 m; (c) -60 m; (d) -30 m; (e) 0 m; (f) +30 m; (g) +60 m; (h) +90 m; (i) +120 m; and (j) +150 m.
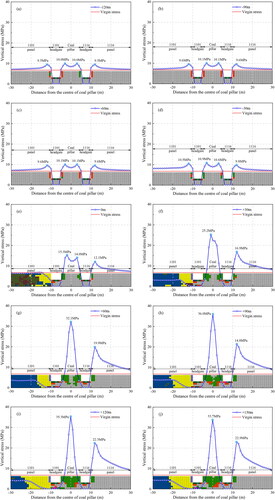
Figure 16. Stope of stress distribution during mining 1116 panel: (a) filling 160 m in stage I; (b) filling 300 m in stage I; (c) filling 160 m in stage II; (d) filling 300 m in stage II; (e) filling 160 m in stage III; (f) filling 300 m in stage III; (g) filling 160 m in stage IV; and (h) filling 300 m in stage IV.
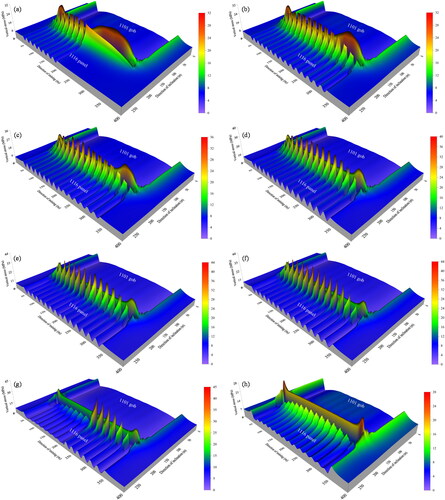
Figure 17. The control system of roadway surrounding rock.
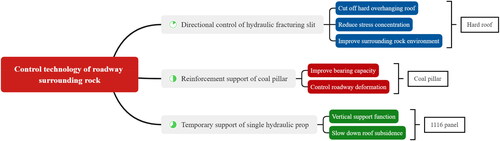
Figure 18. The construction scheme of drilling hydraulic fracturing: (a) plane graph; (b) cross-section graph.
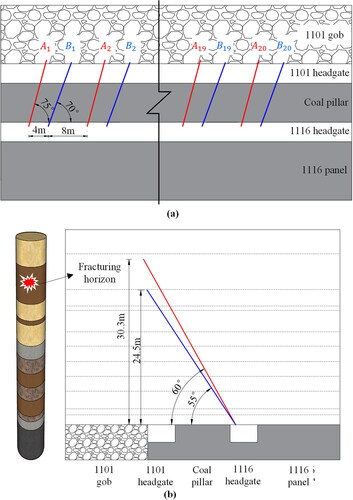
Figure 19. Anchor cable reinforcement support: (a) cross-section graph and (b) side view.
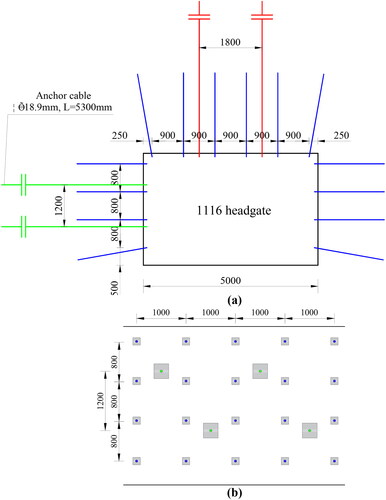
Figure 20. The temporary support of single hydraulic prop.
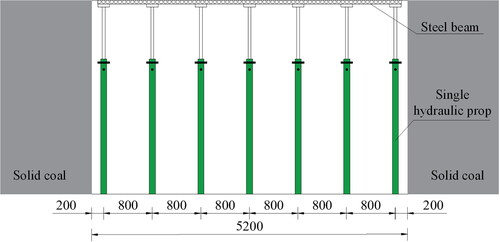
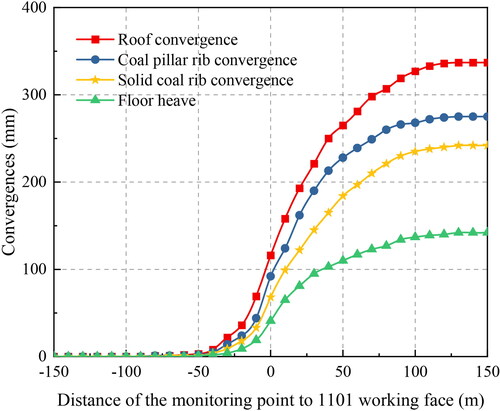
Figure 21. The convergences of roadway.
Data availability statement
Data will be made available on request.