
Figures & data
Figure 1. Sketch of coordinate system of Earth center. R is distance from the center of Earth to the celestial volume, r is distance from a point on earth to the celestial volume, ρ is geocentric directivity, and θ is geocentric zenith distance.
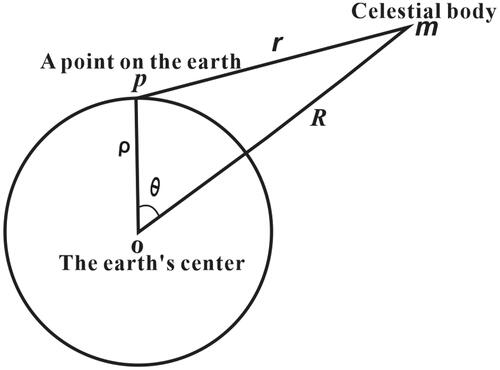
Figure 2. Sketch of horizontal tidal force at point P on the earth. F is tidal tidal forces, Fn is the horizontal tidal forces in the North-South direction, Fe is the horizontal tidal forces in the east-west direction, and β is azimuthal angle of the horizontal tidal force.
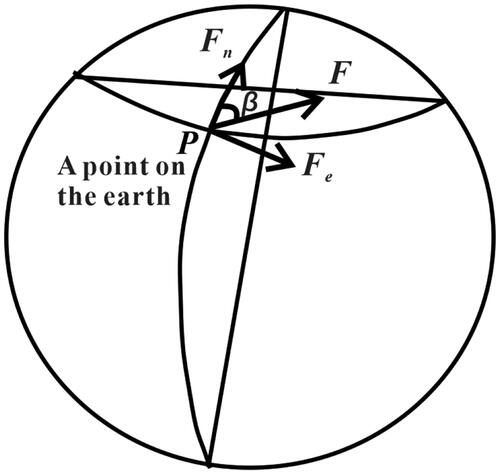
Figure 3. Determination of tide phase angle (Tanaka et al. Citation2004). The peaks are tidal maximum and The Valleys are tidal minimum.
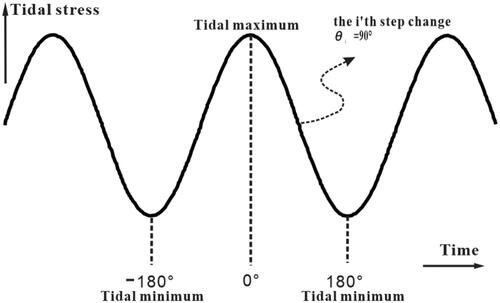
Figure 4. Distribution of moderate earthquakes and faults around the Korla volumetric strain observation station. Local faults (Li et al. Citation2021) are: F1, Singer Fault; F2, Yanji Fault; F3, Baltu Fault; F4, Boroconu-Azikekuduke Fault; F5, Kash river Fault; F6, Sarming Fault; F7, North Luntai Fault; F8, Kumugermu Fault; F9, Qiulitage Fault; F10, Yuli Fault.
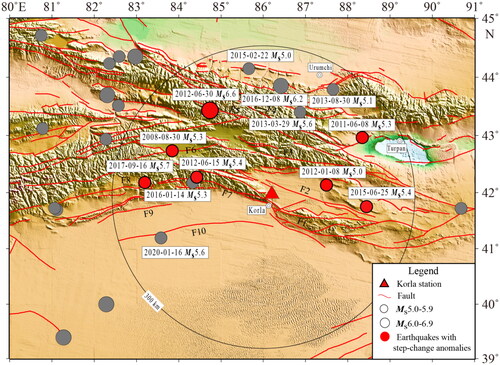
Figure 5. Raw data of the Korla volumetric strain and the earthquakes of magnitude 5.0 and above with 300 km radius centered at the station. Earthquakes marked in red are those with step-change anomalies. Also shown in this figure are the earthquakes of magnitude 4.7–4.9 following the step changes.
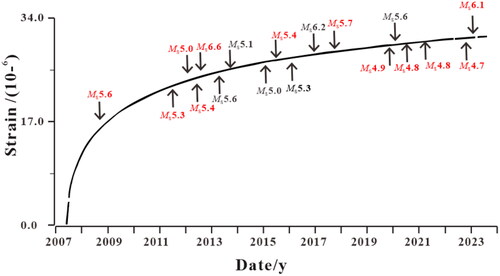
Figure 6. Minutes observation and residual curve of the Korla volumetric strain. (a) Step-change anomalies before the Kuqa MS5.6 earthquake, (b) Oberve curve from 20 to 29 February 2016.
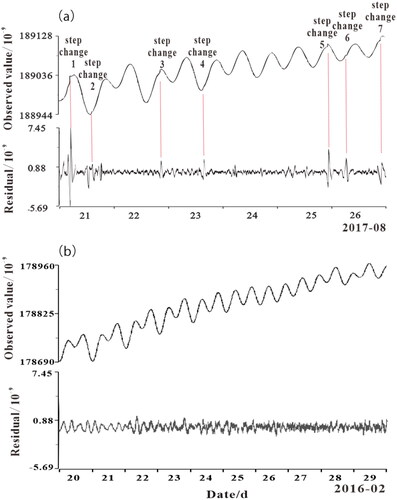
Table 1. Azimuth of tidal force at step-change moment for the Korla volumetric strain before moderate earthquakes.
Figure 7. Synthetic vector diagram of horizontal tidal force for earthquakes. ◆ is the step-change moment, ● is the seismic moment, horizontal coordinate is EW direction, vertical coordinate is NS direction, the ray angle range indicates azimuth concentration of the tidal force. (a) Kuqa MS5.6 earthquake in 2017, (b) Toksun MS5.4 earthquake in 2015, (c) Xinyuan-Hejing MS6.6 and Luntai MS5.4 earthquake in 2012, (d) Heshuo MS5.0 earthquake in 2012, (e) Toksun MS5.3 earthquake in 2011, (f) Hejing MS5.6 earthquake in 2008.
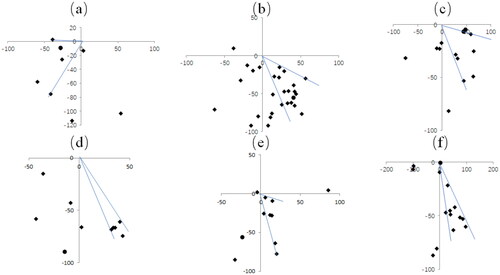
Table 2. Statistics of the tidal phase angle before the moderate earthquake.
Figure 8. Synthetic vector diagram of horizontal tidal force. All the descriptions are the same as the except for the time periods: (a) 17 May to 5 June 2016, (b) 3 July to 9 August 2018, (c) june 9 to 23 August 2019, (d) 4 to 11 November 2019, (e) 24 June to 4 August 2000, (f) 2 to 25 November 2000, (g) 21 February to 24 March 2021, (h) 1 to 25 June 2021, (i) 26 July to 21 August 2021, (j) 12 October to 15 November 2022, (k) 6 to 27 January 2023.
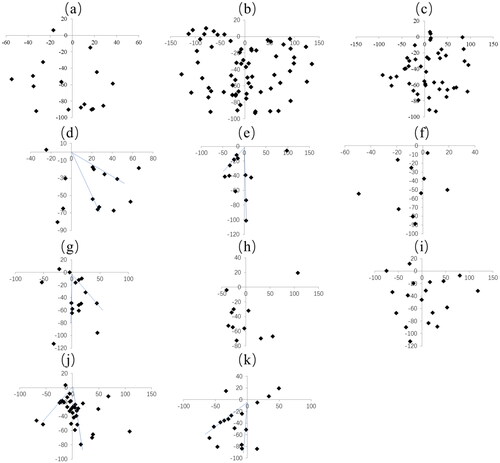
Figure 9. Phase angle statistics of strain step-change anomalies in the Korla volumetric strain.
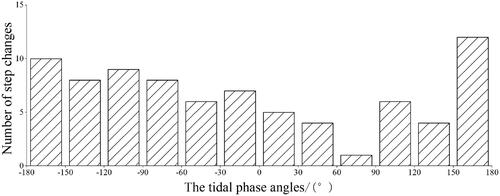
Table 3. Statistics of seismic source parameters.
Data availability statement
All data used during the study are available from the corresponding author by request.