
Figures & data
Table 1. Seismic risk classes and corresponding PAM values.
Table 2. Attribution of the initial vulnerability class based on the masonry type.
Figure 1. Zones (from 1 to 4) of Italy based on seismic hazard. PGA with probability of exceeding 10% in 50 years.
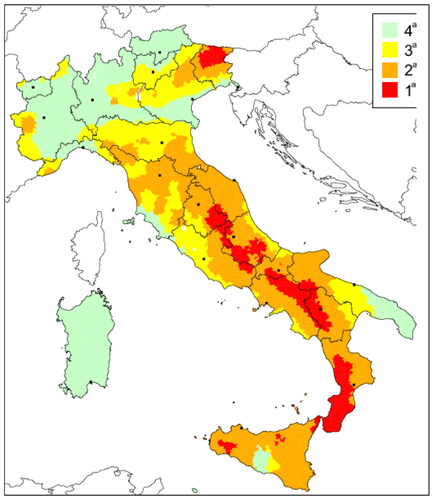
Figure 2. Block diagram of the method.
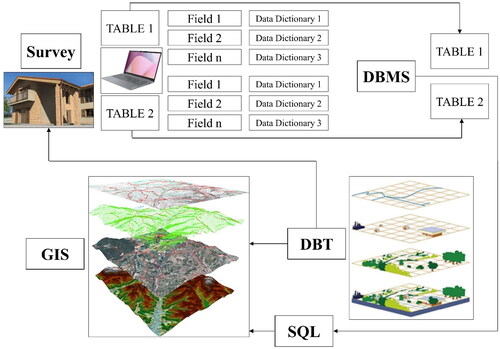
Figure 3. Representation of Tables A and B with their respective fields and attributes (in italics).
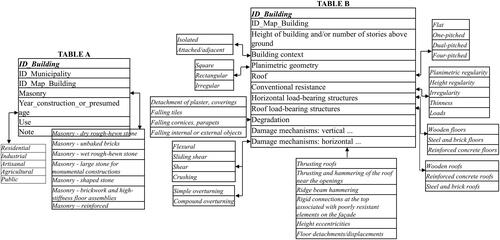
Figure 4. Exemplary drawings and photographs of some elements defined in .
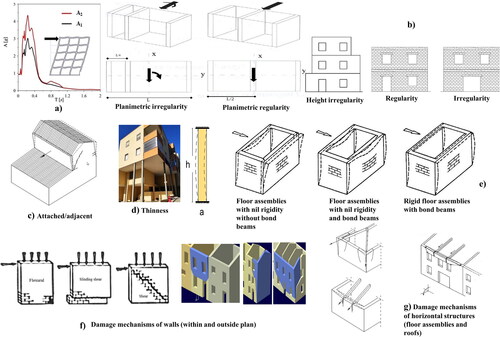
Figure 5. Entity–relationship model (or ER model) of the DBMS.
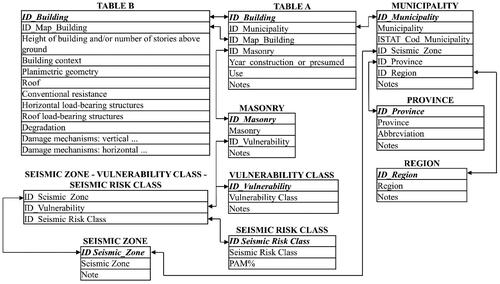
Figure 6. Diagrams of some of the described queries and corresponding tables.
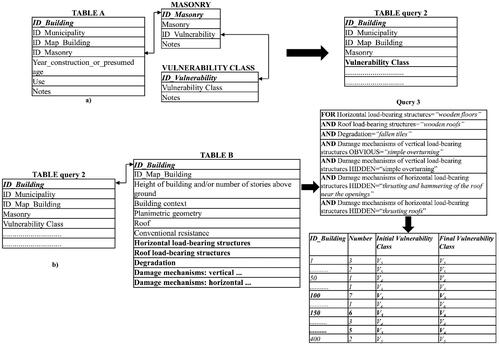
Table 3. Elements of the shift from the initial vulnerability class to the final one.
Figure 7. Area under study with the epicenter of the earthquake indicated.
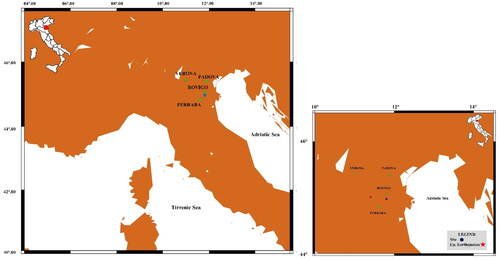
Figure 8. Summary of the main structural types with some photographs.
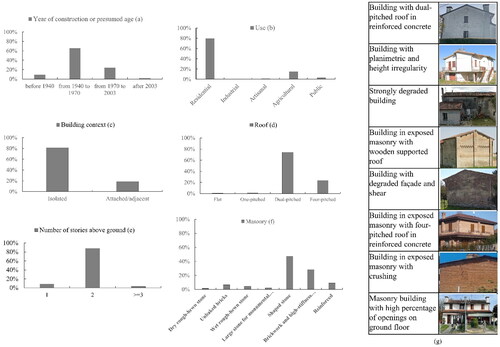
Figure 9. Final vulnerability class (a) and seismic risk class (b) based on the percentage of masonry buildings surveyed.
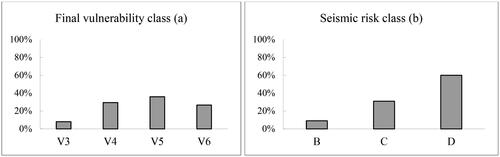
Table 4. Seismic risk classes and corresponding PAM as a function of the percentage of masonry buildings surveyed.
Figure 10. 1:5000 scale map showing the cataloging of buildings according to seismic risk class.
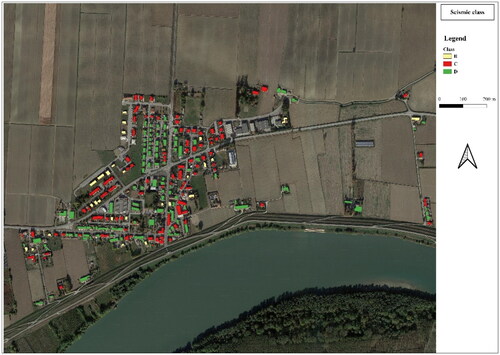
Table 5. Comparisons between the proposed simplified method and the rigorous conventional and Cartis form methods.
Data availability statement
The data processed by the author in this paper are available upon request to him.