
Figures & data
Figure 1. Study area map.
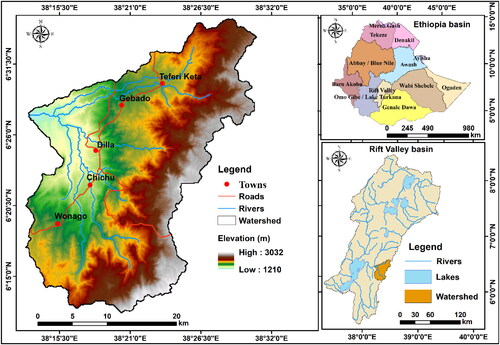
Figure 2. Methodology flowchart.
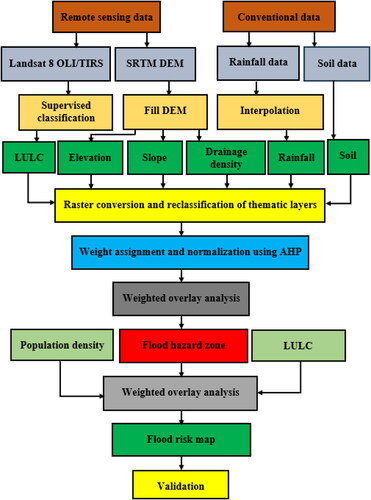
Figure 3. Slope (a), elevation (b), rainfall (c), LULC (d), drainage density (e), and soil map (f).
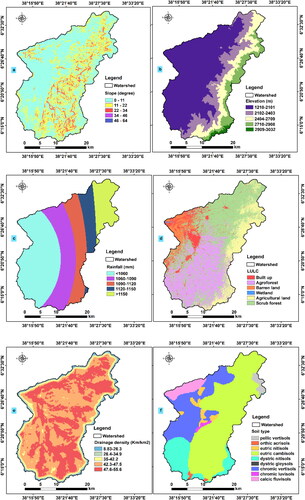
Table 1. Susceptibility level of sub-factors to flood hazard.
Figure 4. Population density map.
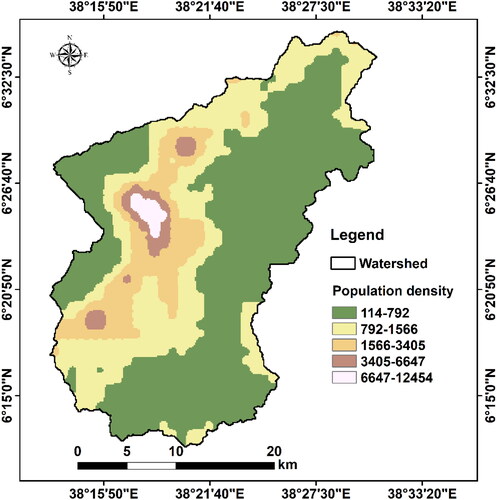
Table 4. Susceptibility level of sub-factors to flood risk.
Table 2. Pairwise comparison matrix of parameters.
Table 3. Normalized weight of parameters.
Figure 5. Flood hazard zone map.
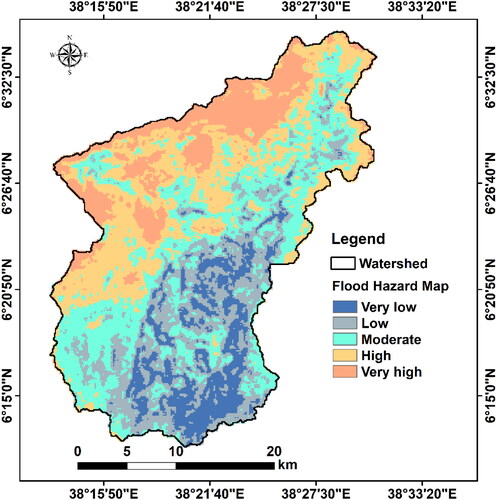
Figure 6. Flood risk map.
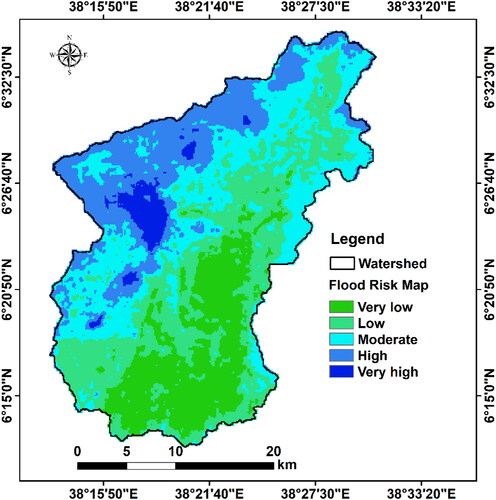
Table 5. Area coverage of the flood hazard zone.
Table 6. Area coverage of flood risk.
Figure 7. Flood risk zone area coverage in percentage.
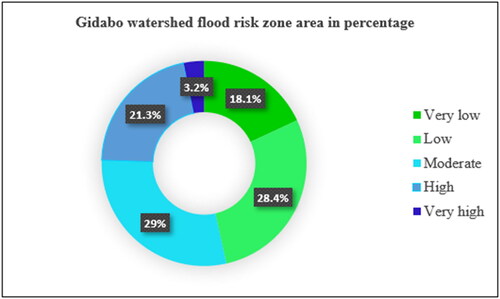
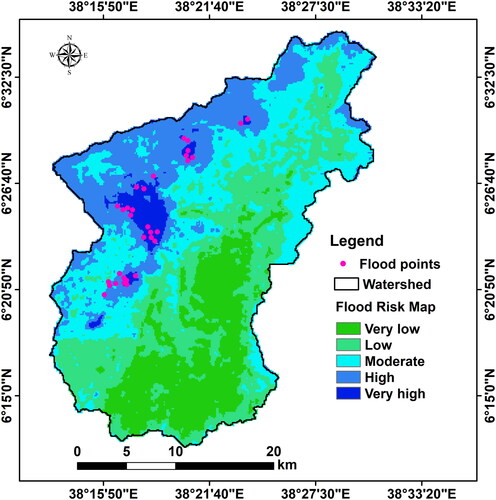
Figure 8. Distribution of flooding risk sites.
Data availability statement
The datasets used and/or analyzed during the current study are available in the article/from the corresponding author on request.