
Figures & data
Figure 1. Analysis of particle grading curve for landslide dams.
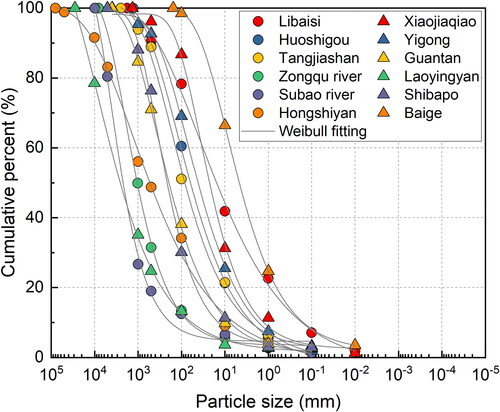
Figure 2. Procedure for obtaining spatial particle size.
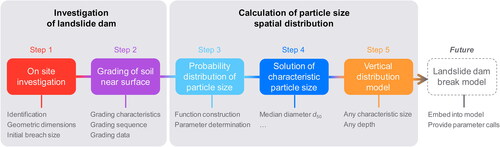
Figure 3. Vertical and horizontal continuous expansion of the breach.
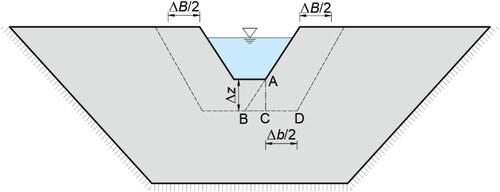
Figure 4. Stability calculation of breach slope.
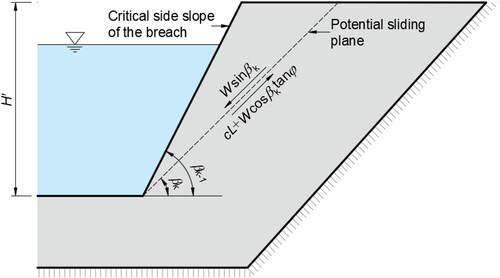
Figure 5. The model calculation process of the mathematical model.
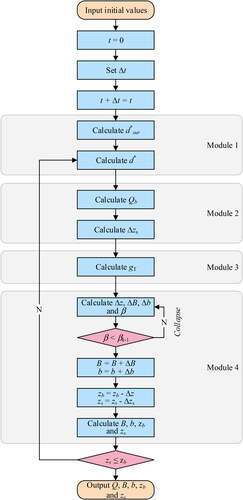
Figure 6. The (a) full extent, (b) cross-section, and (c) longitudinal section of the Tangjiashan landslide dam (Hu et al. Citation2010).
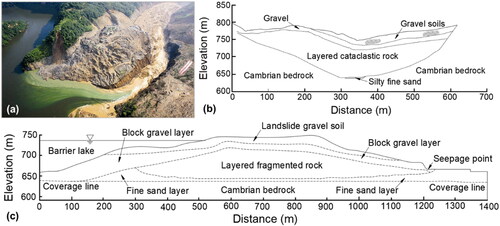
Figure 7. Grading analysis of Tangjiashan landslide dam.
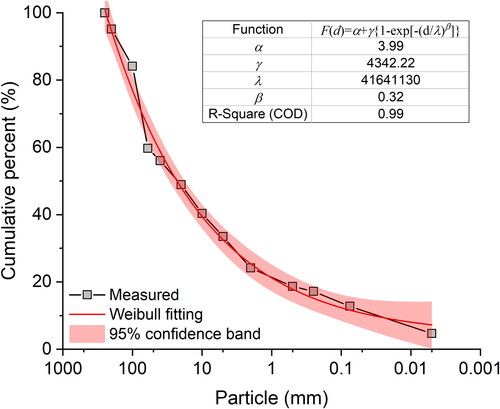
Table 1. Conditions of Tangjiashan landslide dam.
Figure 8. The (a) cross-section, (b) longitudinal section of Baige landslide dam (Zhong et al. Citation2020b).
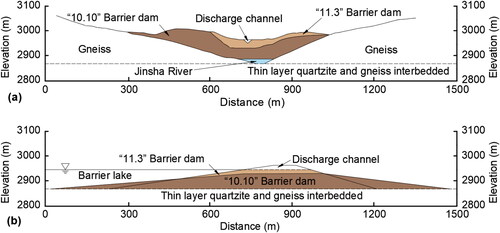
Figure 9. Grading analysis of Baige landslide dam.
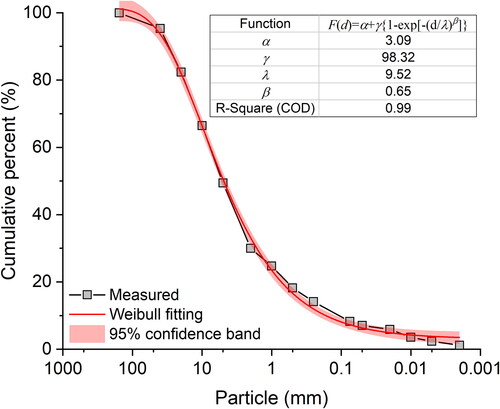
Table 2. Conditions of Baige landslide dam.
Figure 10. Analysis of discharge coefficients.
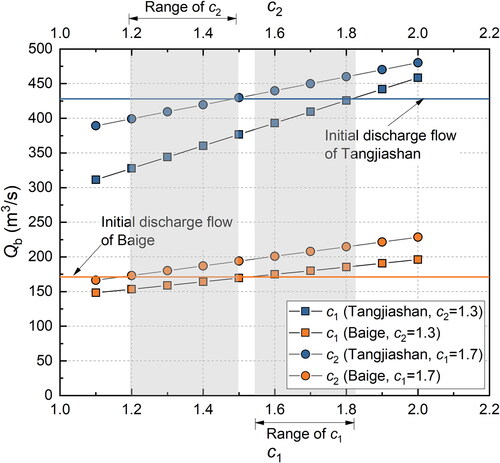
Figure 11. The failure process of Tangjiashan landslide dam: (a) the discharge process; (b) the breach development; (c) the reservoir water level development.
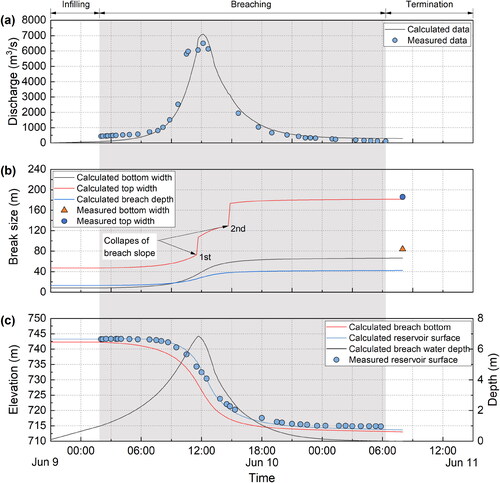
Figure 12. The failure process of Baige landslide dam: (a) the discharge process; (b) the breach development; (c) the reservoir water level development.
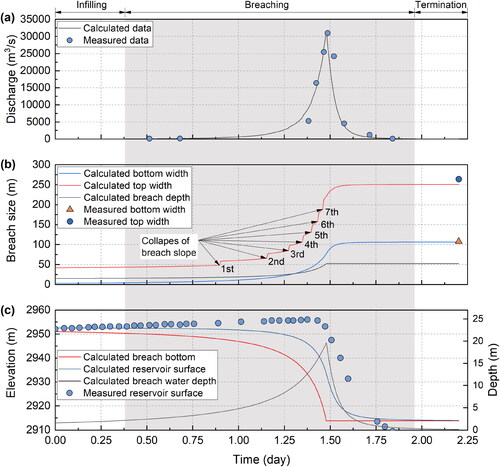
Table 3. Comparison of breaching outcomes of Tangjiashan landslide dam.
Table 4. Comparison of breaching outcomes of Baige landslide dam.
Table 5. Comparison between calculated and measured data of Tangjiashan landslide dam breach.
Table 6. Comparison of measured and calculated data of Baige landslide dam breach.
Figure 13. The failure process of Tangjiashan landslide dam under different median particle sizes: (a) discharge of breach; (b) development of breach.
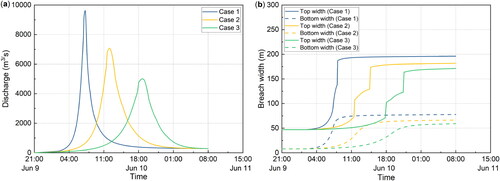
Table 7. Influence of particle size on the dam breach process.
Figure 14. The failure process of Tangjiashan landslide dam under different particle distributions: (a) discharge of breach; (b) development of breach.
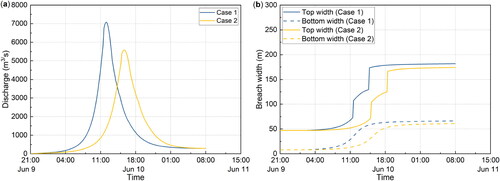
Table 8. Influence of particle distribution on the dam breach process.
Data availability statement
The input parameters and output results of the breach model used for real-world dam break calculation in this article are available from the digital data repository in Zhao (Citation2024).