
Figures & data
Figure 1. Location of the study area: the names of 6 provinces are shown.
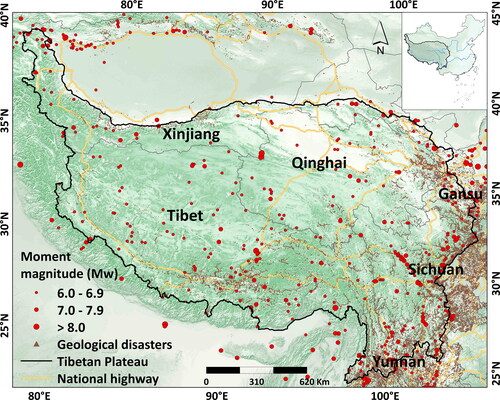
Figure 2. Methodology flow chart of this study.
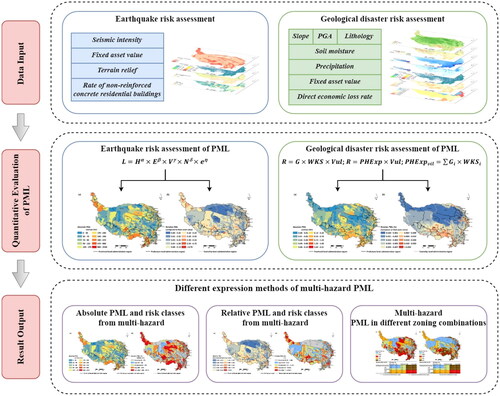
Table 1. The probability of occurrence of geological hazard events within a 1 km2 spatial grid unit.
Table 2. Multi-hazard risk classification method based on the expected DEL risk level induced by a single hazard.
Figure 3. Township-level absolute value (a) and risk class (b) of multi-hazard PML on the TP.
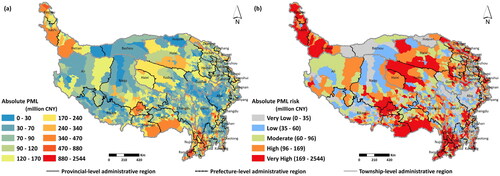
Figure 4. Township-level relative value (a) and risk class (b) of multi-hazard PML on the TP.
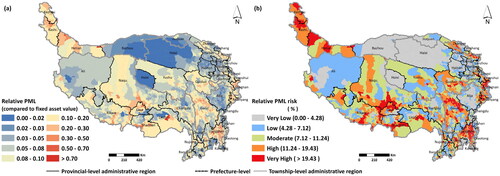
Figure 5. Absolute risk class (a) and relative risk class (b) of multi-hazard PML at the township-level on the TP.
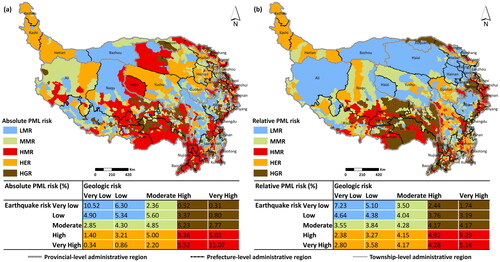
Table 3. PML for multi-hazard and fixed asset values in six provinces.
Figure 6. Proportion of NSCRB in Tibet in 2010 (a) and 2020 (b).
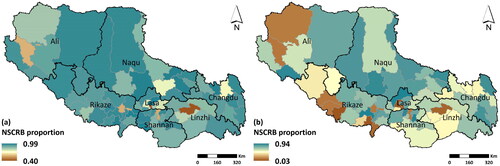
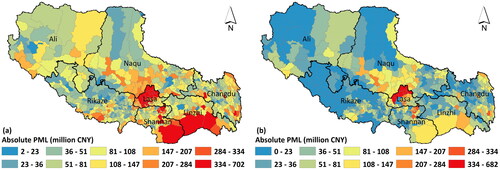
Figure 7. The multi-hazard PML in Tibet for 2010 (a) and 2020 (b).
Supplemental Material
Download MS Word (14 MB)Data availability statement
The data that support the findings of this study are available from the corresponding author on reasonable request.