
Figures & data
Figure 1. Location of study area in China (left panel), terrain height (right panel, shaded, unit: m), and the distribution of PM2.5 ground monitoring sites (black dots).
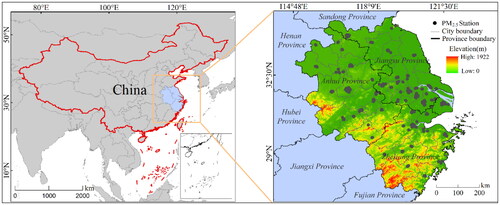
Figure 2. (a) Scatter plots of the predicted PM2.5 concentrations against observations, along with the values of R2, RMSE (µg m−3), and sample size (N), (b) Accuracy value for k-fold DNN classifiers (k = 1,2…,10).
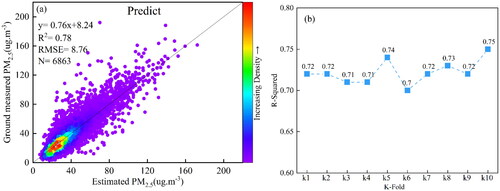
Figure 3. Seasonal spatial distributions of AOD from MODIS (first row), predicted PM2.5 concentrations (second row), and ground-based PM2.5 observations (solid circles, second row) in the YRD region from 2019 to 2022.
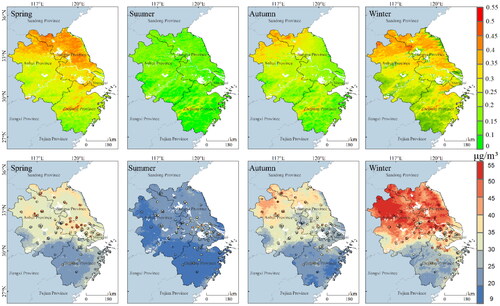
Figure 4. Variation of observed (a,c) and estimated (b,d) PM2.5 concentrations in 14 large cities in the YRD region during the lockdown period (a,b) and the lift lockdown period (c,d).
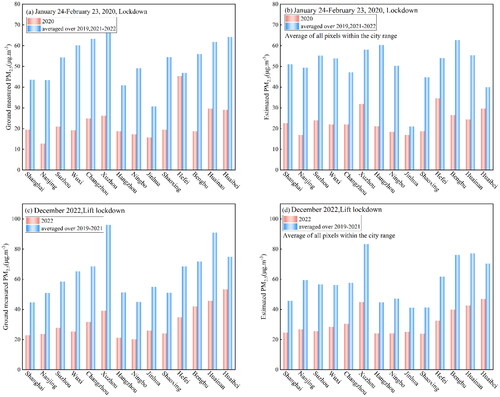
Figure 5. Comparison of AOD values in suzhou during the lockdown period (a–d) and the lift lockdown period (e–h). The red circles indicate urban areas, the blue circle indicates the industrial area and the purple circles indicate Sub-urban areas.
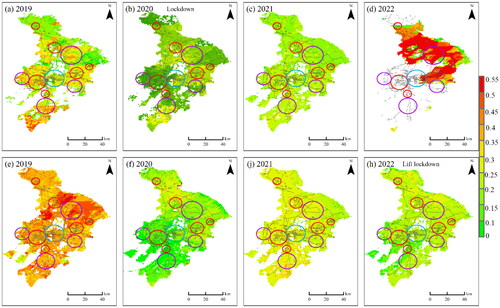
Table 1. Changes in intra-city AOD concentrations in Suzhou during the lockdown and lift lockdown periods.
Figure 6. Same as but for predicted (shaded) and observed (dotted) PM2.5 concentrations.
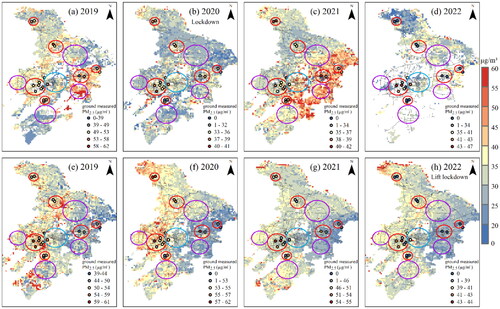
Table 2. Changes in intra-city PM2.5 concentrations in Suzhou during the lockdown and lift lockdown periods.
Supporting Information20240702.docx
Download MS Word (8.8 MB)Data availability statement
The datasets are not publicly available due to data privacy but are available from the corresponding author on reasonable request.