Figures & data
Table 1. Ever married (0 = never married, 1 = ever married) among men, regressed on total income, education, home ownership, and sex ratio, based on a binomial error structure and with year of birth and race as random factors.
Table 2. Ever married (0= never married, 1= ever married) among women, regressed on total income, education, home ownership, and sex ratio based on a binomial error structure and with year of birth and race as random factors.
Figure 1. Percentage of never-married individuals by birth year cohort. Blue line for men, red line for women.
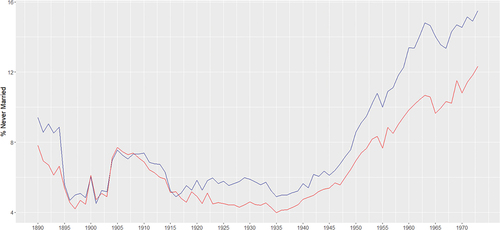
Figure 2. a) Men: Time series of the variance of ever married explained by total income (in %) by birth year cohort. b) Time series of the corresponding regression estimates. Original time series (black line) and loess smoother with confidence intervals.
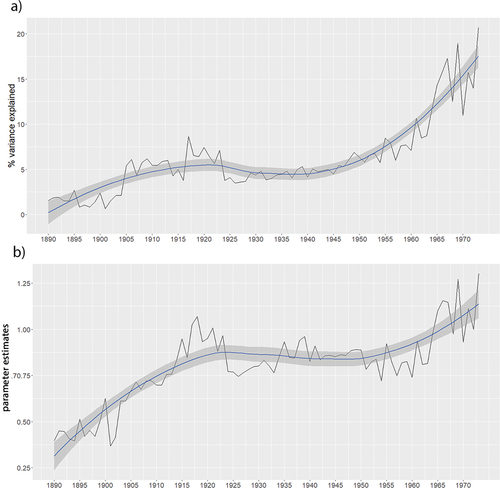
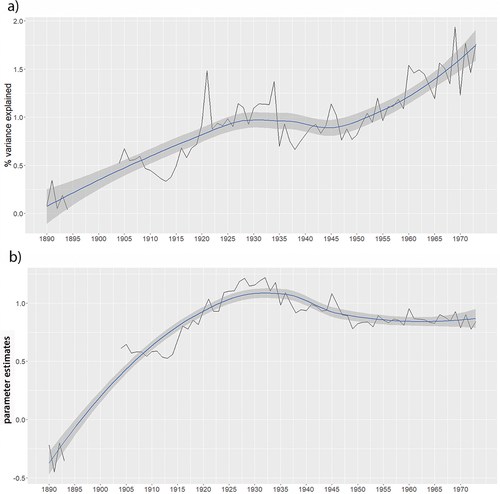
Figure 3. 3a) Men: Time series of the variance of ever married explained by education (in %) by birth year cohort. b) Time series of the corresponding regression estimates. Original time series (black line), loess smoother with confidence intervals.
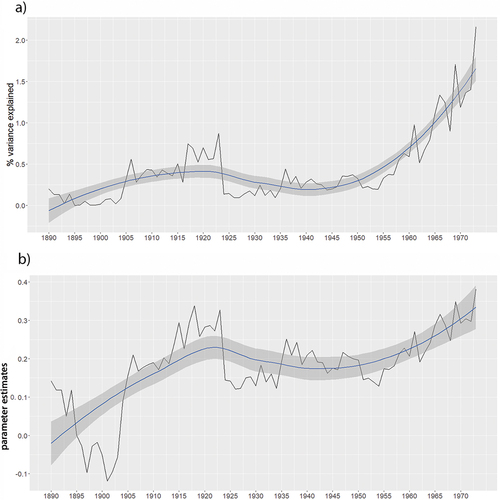
Figure 4. a) Men: Time series of the variance of ever-married explained by homeownership (in %) by birth year cohort. b) Time series of the corresponding regression estimates. Original time series (black line), loess smoother with confidence intervals. Data are missing for the birth years 1893–1913.
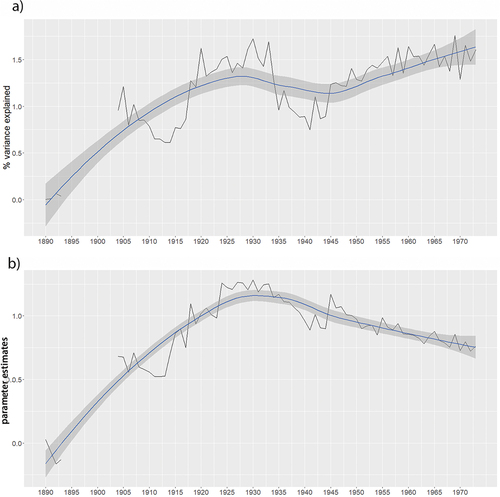
Figure 5. a) Women: Time series of the variance of ever married explained by income (in %) by birth year cohort. b) Time series of the corresponding regression estimates. Original time series (black line), loess smoother with confidence intervals.
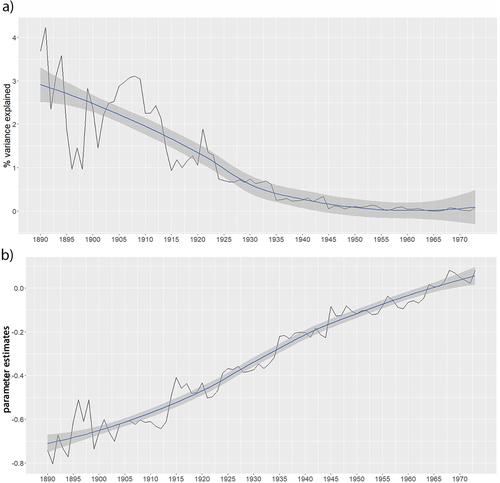
Figure 6. a) Women: Time series of the variance of ever married explained by education (in %) by birth year cohort. b) Time series of the corresponding regression estimates. Original time series (black line), loess smoother with confidence intervals.
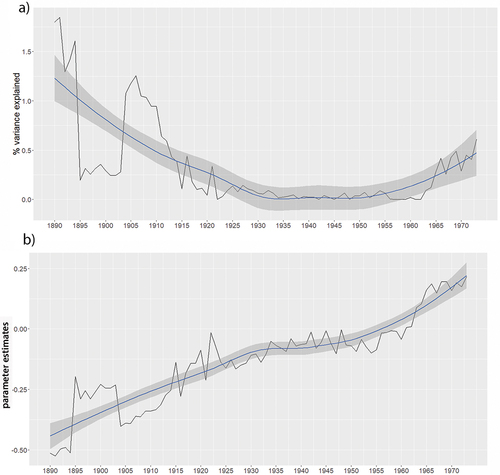
Figure 7. a) Women: Time series of the variance of ever married explained by home ownership (in %) by birth year cohort. b) Time series of the corresponding regression estimates. Original time series (black line), loess smoother with confidence intervals. Data are missing for birth years 1893–1913.