1,808
Views
30
CrossRef citations to date
0
Altmetric
Research Paper

Potential for using a hermetically-sealed, positive-pressured isocage system for studies involving germ-free mice outside a flexible-film isolator

, , , , , , , & show all
Pages 255-265 | Received 26 Mar 2015, Accepted 15 Jun 2015, Published online: 25 Jul 2015

Figures & data

Figure 1. Procedure for working aseptically with isopositive cages. To minimize the risk of contamination when performing procedures on germ-free or colonized mice housed in isopositive cages, personnel donned sterile gowns and gloves, and cages were disinfected with Clidox solution (1:3:1). (A) The sterile person donning sterile surgical gown and gloves. (B) The sterile person working within the biosafety cabinet following aseptic technique. Only autoclaved or Clidox disinfected materials are introduced into the biosafety cabinet and handled by the sterile person. (C) Dunk tank and rubber gloves used by the assistant to completely submerge isopositive cages in Clidox. (D) Assistant submerging the hermetically sealed isopositive cage into 1:3:1 Clidox prior to placing the cage into a previously disinfected biosafety cabinet.
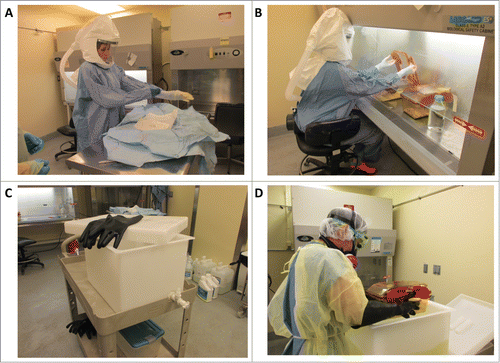
Figure 1. Procedure for working aseptically with isopositive cages. To minimize the risk of contamination when performing procedures on germ-free or colonized mice housed in isopositive cages, personnel donned sterile gowns and gloves, and cages were disinfected with Clidox solution (1:3:1). (A) The sterile person donning sterile surgical gown and gloves. (B) The sterile person working within the biosafety cabinet following aseptic technique. Only autoclaved or Clidox disinfected materials are introduced into the biosafety cabinet and handled by the sterile person. (C) Dunk tank and rubber gloves used by the assistant to completely submerge isopositive cages in Clidox. (D) Assistant submerging the hermetically sealed isopositive cage into 1:3:1 Clidox prior to placing the cage into a previously disinfected biosafety cabinet.

Table 1. Testing results for bacterial growth using pooled fecal samples from mice housed in isopositive cages

Figure 2. PCR analysis of 16s rRNA from baseline fecal samples. Prior to fecal transfer, pooled fecal samples were collected from each isopositive cage and tested for the presence of bacteria by 16s rRNA PCR. (A) Samples from the first study testing fecal transfer stability. (B) Samples from the second study using samples from donors fed a control or high vitamin D diet. Each lane represents a pooled sample from each isopositive cage; H2O, negative control; SPF cont, DNA from feces of animals housed in the SPF facility.
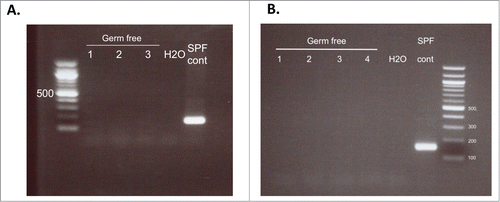
Figure 2. PCR analysis of 16s rRNA from baseline fecal samples. Prior to fecal transfer, pooled fecal samples were collected from each isopositive cage and tested for the presence of bacteria by 16s rRNA PCR. (A) Samples from the first study testing fecal transfer stability. (B) Samples from the second study using samples from donors fed a control or high vitamin D diet. Each lane represents a pooled sample from each isopositive cage; H2O, negative control; SPF cont, DNA from feces of animals housed in the SPF facility.

Figure 3. Fecal transfer results in smaller ceca and shorter small intestines. Germ-free mice were gavaged with a fecal slurry generated from mice housed in an SPF facility. Four weeks following fecal transfer, mice were euthanized and phenotypic changes in the gastrointestinal tract were assessed. (A) Fecal transfer to germ-free mice (left) results in smaller ceca compared to mice that remained germ-free (right). (B) Fecal transfer shortened the length of the small intestine. Intestine of a germ-free mouse following fecal transfer (left); intestine of a germ free mouse (right). Arrows point to cecum.
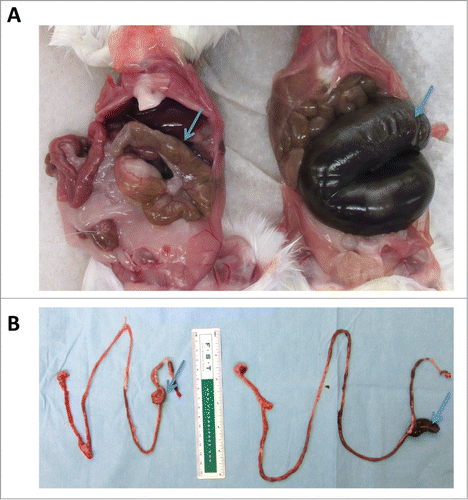
Figure 3. Fecal transfer results in smaller ceca and shorter small intestines. Germ-free mice were gavaged with a fecal slurry generated from mice housed in an SPF facility. Four weeks following fecal transfer, mice were euthanized and phenotypic changes in the gastrointestinal tract were assessed. (A) Fecal transfer to germ-free mice (left) results in smaller ceca compared to mice that remained germ-free (right). (B) Fecal transfer shortened the length of the small intestine. Intestine of a germ-free mouse following fecal transfer (left); intestine of a germ free mouse (right). Arrows point to cecum.

Figure 4. Heat map of major OTU relative abundances in the fecal transplant experiment. The Ln of the normalized reads per OTU is shown. The hierarchical clustering was performed using average linkage of samples and OTUs based on Bray–Curtis dissimilarity index of relative abundance profiles. The sample names indicate cage number (1, 2, 3), ear tag (R for right, L for left, N for none), sex (M, F), and week (1, 2, 4) preceded by an underscore. The samples cluster almost entirely by sex and then time.
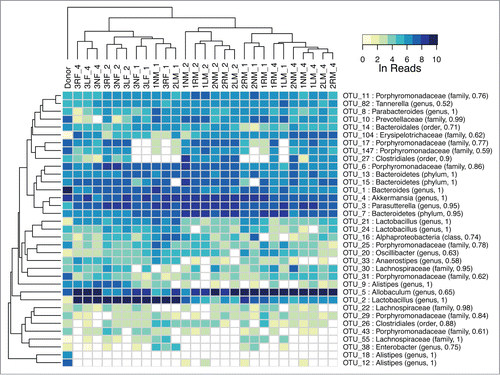
Figure 4. Heat map of major OTU relative abundances in the fecal transplant experiment. The Ln of the normalized reads per OTU is shown. The hierarchical clustering was performed using average linkage of samples and OTUs based on Bray–Curtis dissimilarity index of relative abundance profiles. The sample names indicate cage number (1, 2, 3), ear tag (R for right, L for left, N for none), sex (M, F), and week (1, 2, 4) preceded by an underscore. The samples cluster almost entirely by sex and then time.

Figure 5. (A) Multidimensional scaling of OTU abundances from the fecal transplant experiment. The donor sample is shown as a black dot (upper right). Males are shown in cyan and females in magenta. The inner circle indicates time post fecal transplant in weeks as white, gray and black for one, 2 and 4 weeks, respectively. After the initial transplant, the samples diverge from the donor at week one and become more donor-like as time progresses. Males and females appear to separate into distinct groups. (B) Community complexity for fecal transplant experiment by Shannon index. The donor sample is shown at week 0. There is no significant difference by sex.
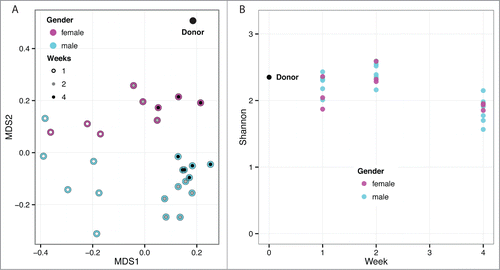
Figure 5. (A) Multidimensional scaling of OTU abundances from the fecal transplant experiment. The donor sample is shown as a black dot (upper right). Males are shown in cyan and females in magenta. The inner circle indicates time post fecal transplant in weeks as white, gray and black for one, 2 and 4 weeks, respectively. After the initial transplant, the samples diverge from the donor at week one and become more donor-like as time progresses. Males and females appear to separate into distinct groups. (B) Community complexity for fecal transplant experiment by Shannon index. The donor sample is shown at week 0. There is no significant difference by sex.

Figure 6. Heat map of major OTU relative abundances in the fecal transplant experiment using 2 different donor samples from mice fed a control and a high vitamin D diet. The Ln of the normalized reads per OTU is shown. The hierarchical clustering was performed using average linkage of samples and OTUs based on Bray–Curtis dissimilarity index of relative abundance profiles. The sample names indicate diet of donors (C for control, D for high vitamin D), cage number (1, 2, 3), ear tag (R for right, L for left, N for none), sex (M, F), and week (1, 2, 4) preceded by an underscore. There is a strong tendency for the week 2 and 4 samples to cluster by diet.
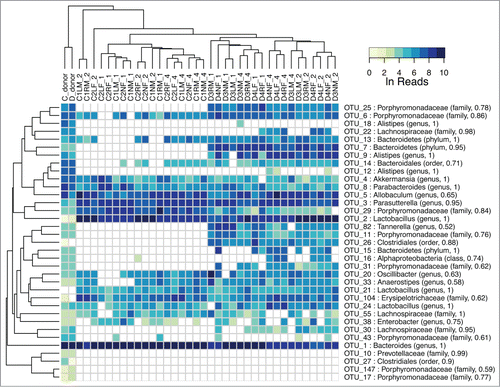
Figure 6. Heat map of major OTU relative abundances in the fecal transplant experiment using 2 different donor samples from mice fed a control and a high vitamin D diet. The Ln of the normalized reads per OTU is shown. The hierarchical clustering was performed using average linkage of samples and OTUs based on Bray–Curtis dissimilarity index of relative abundance profiles. The sample names indicate diet of donors (C for control, D for high vitamin D), cage number (1, 2, 3), ear tag (R for right, L for left, N for none), sex (M, F), and week (1, 2, 4) preceded by an underscore. There is a strong tendency for the week 2 and 4 samples to cluster by diet.

Figure 7. (A) Multidimensional scaling of OTU abundances from the fecal transplant experiment with donors fed a control and high vitamin D diet. The single black data points (lower right corner) represent the 2 donor samples for the control and high vitamin D diet. Triangles represent high vitamin D and circles represent control diet. The cyan and magenta indicate sex (male and female, respectively) while the inner color indicates time post fecal transplant in weeks as white, gray and black for one, 2 and 4 weeks, respectively. As with the initial fecal transplant study, the samples diverge from the donors rapidly but begin to become more donor-like by week 4. There is a strong division between the 2 diets in post-transplant. (B) Community complexity for fecal transplant with donors fed control and high vitamin-D diets. The donor samples for each diet are shown at week 0. There is no significant difference by sex, however, the microbiota from high vitamin-D diet appears to establish a more diverse bacterial community.
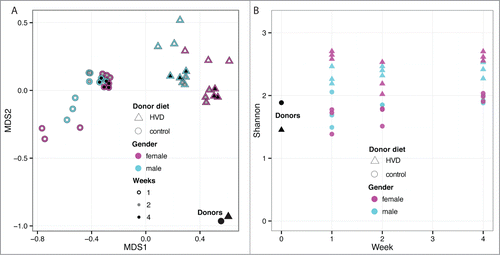
Figure 7. (A) Multidimensional scaling of OTU abundances from the fecal transplant experiment with donors fed a control and high vitamin D diet. The single black data points (lower right corner) represent the 2 donor samples for the control and high vitamin D diet. Triangles represent high vitamin D and circles represent control diet. The cyan and magenta indicate sex (male and female, respectively) while the inner color indicates time post fecal transplant in weeks as white, gray and black for one, 2 and 4 weeks, respectively. As with the initial fecal transplant study, the samples diverge from the donors rapidly but begin to become more donor-like by week 4. There is a strong division between the 2 diets in post-transplant. (B) Community complexity for fecal transplant with donors fed control and high vitamin-D diets. The donor samples for each diet are shown at week 0. There is no significant difference by sex, however, the microbiota from high vitamin-D diet appears to establish a more diverse bacterial community.
Supplemental material

Supplemental_Material.zip

Download Zip (229.5 KB)

Reprints and Corporate Permissions

Please note: Selecting permissions does not provide access to the full text of the article, please see our help page How do I view content?

To request a reprint or corporate permissions for this article, please click on the relevant link below:

Academic Permissions

Please note: Selecting permissions does not provide access to the full text of the article, please see our help page How do I view content?

Obtain permissions instantly via Rightslink by clicking on the button below:

If you are unable to obtain permissions via Rightslink, please complete and submit this Permissions form. For more information, please visit our Permissions help page.